Variable Acceptance Sampling for Transverse Finish Uniformity
Variable acceptance sampling under ISO 3951 verifies transverse finish uniformity by testing continuous mass add-on against statistical tolerance limits.


Web
Liquor expression at the foulard mangle determines the chemical finish distribution across the width of continuous roll goods before the material enters drying chambers. Uneven pneumatic cylinder pressure across the roll face creates a lateral load gradient. Deflection of the steel core relative to the rubber sleeve produces a classic concave or convex squeeze profile.
Consequently, the wet pick-up varies from the drive side to the operator side, creating persistent finish density differentials across the selvage, quarter, and center positions.
Pad pressure drops outward.
When goods pass through a padder at forty meters per minute, fluid displacement follows mechanical deflection lines. In a foulard running a fluorocarbon-free water-repellent emulsion at forty grams per liter, a pressure drop of 0.4 bar between the center and the drive-side edge shifts the wet pick-up from sixty-eight percent at the core to seventy-six percent at the pin chains. This physical reality invalidates single-point coupon testing.
A specimen cut from one roll edge reveals nothing about the deposition level at mid-width or along the opposing selvage.
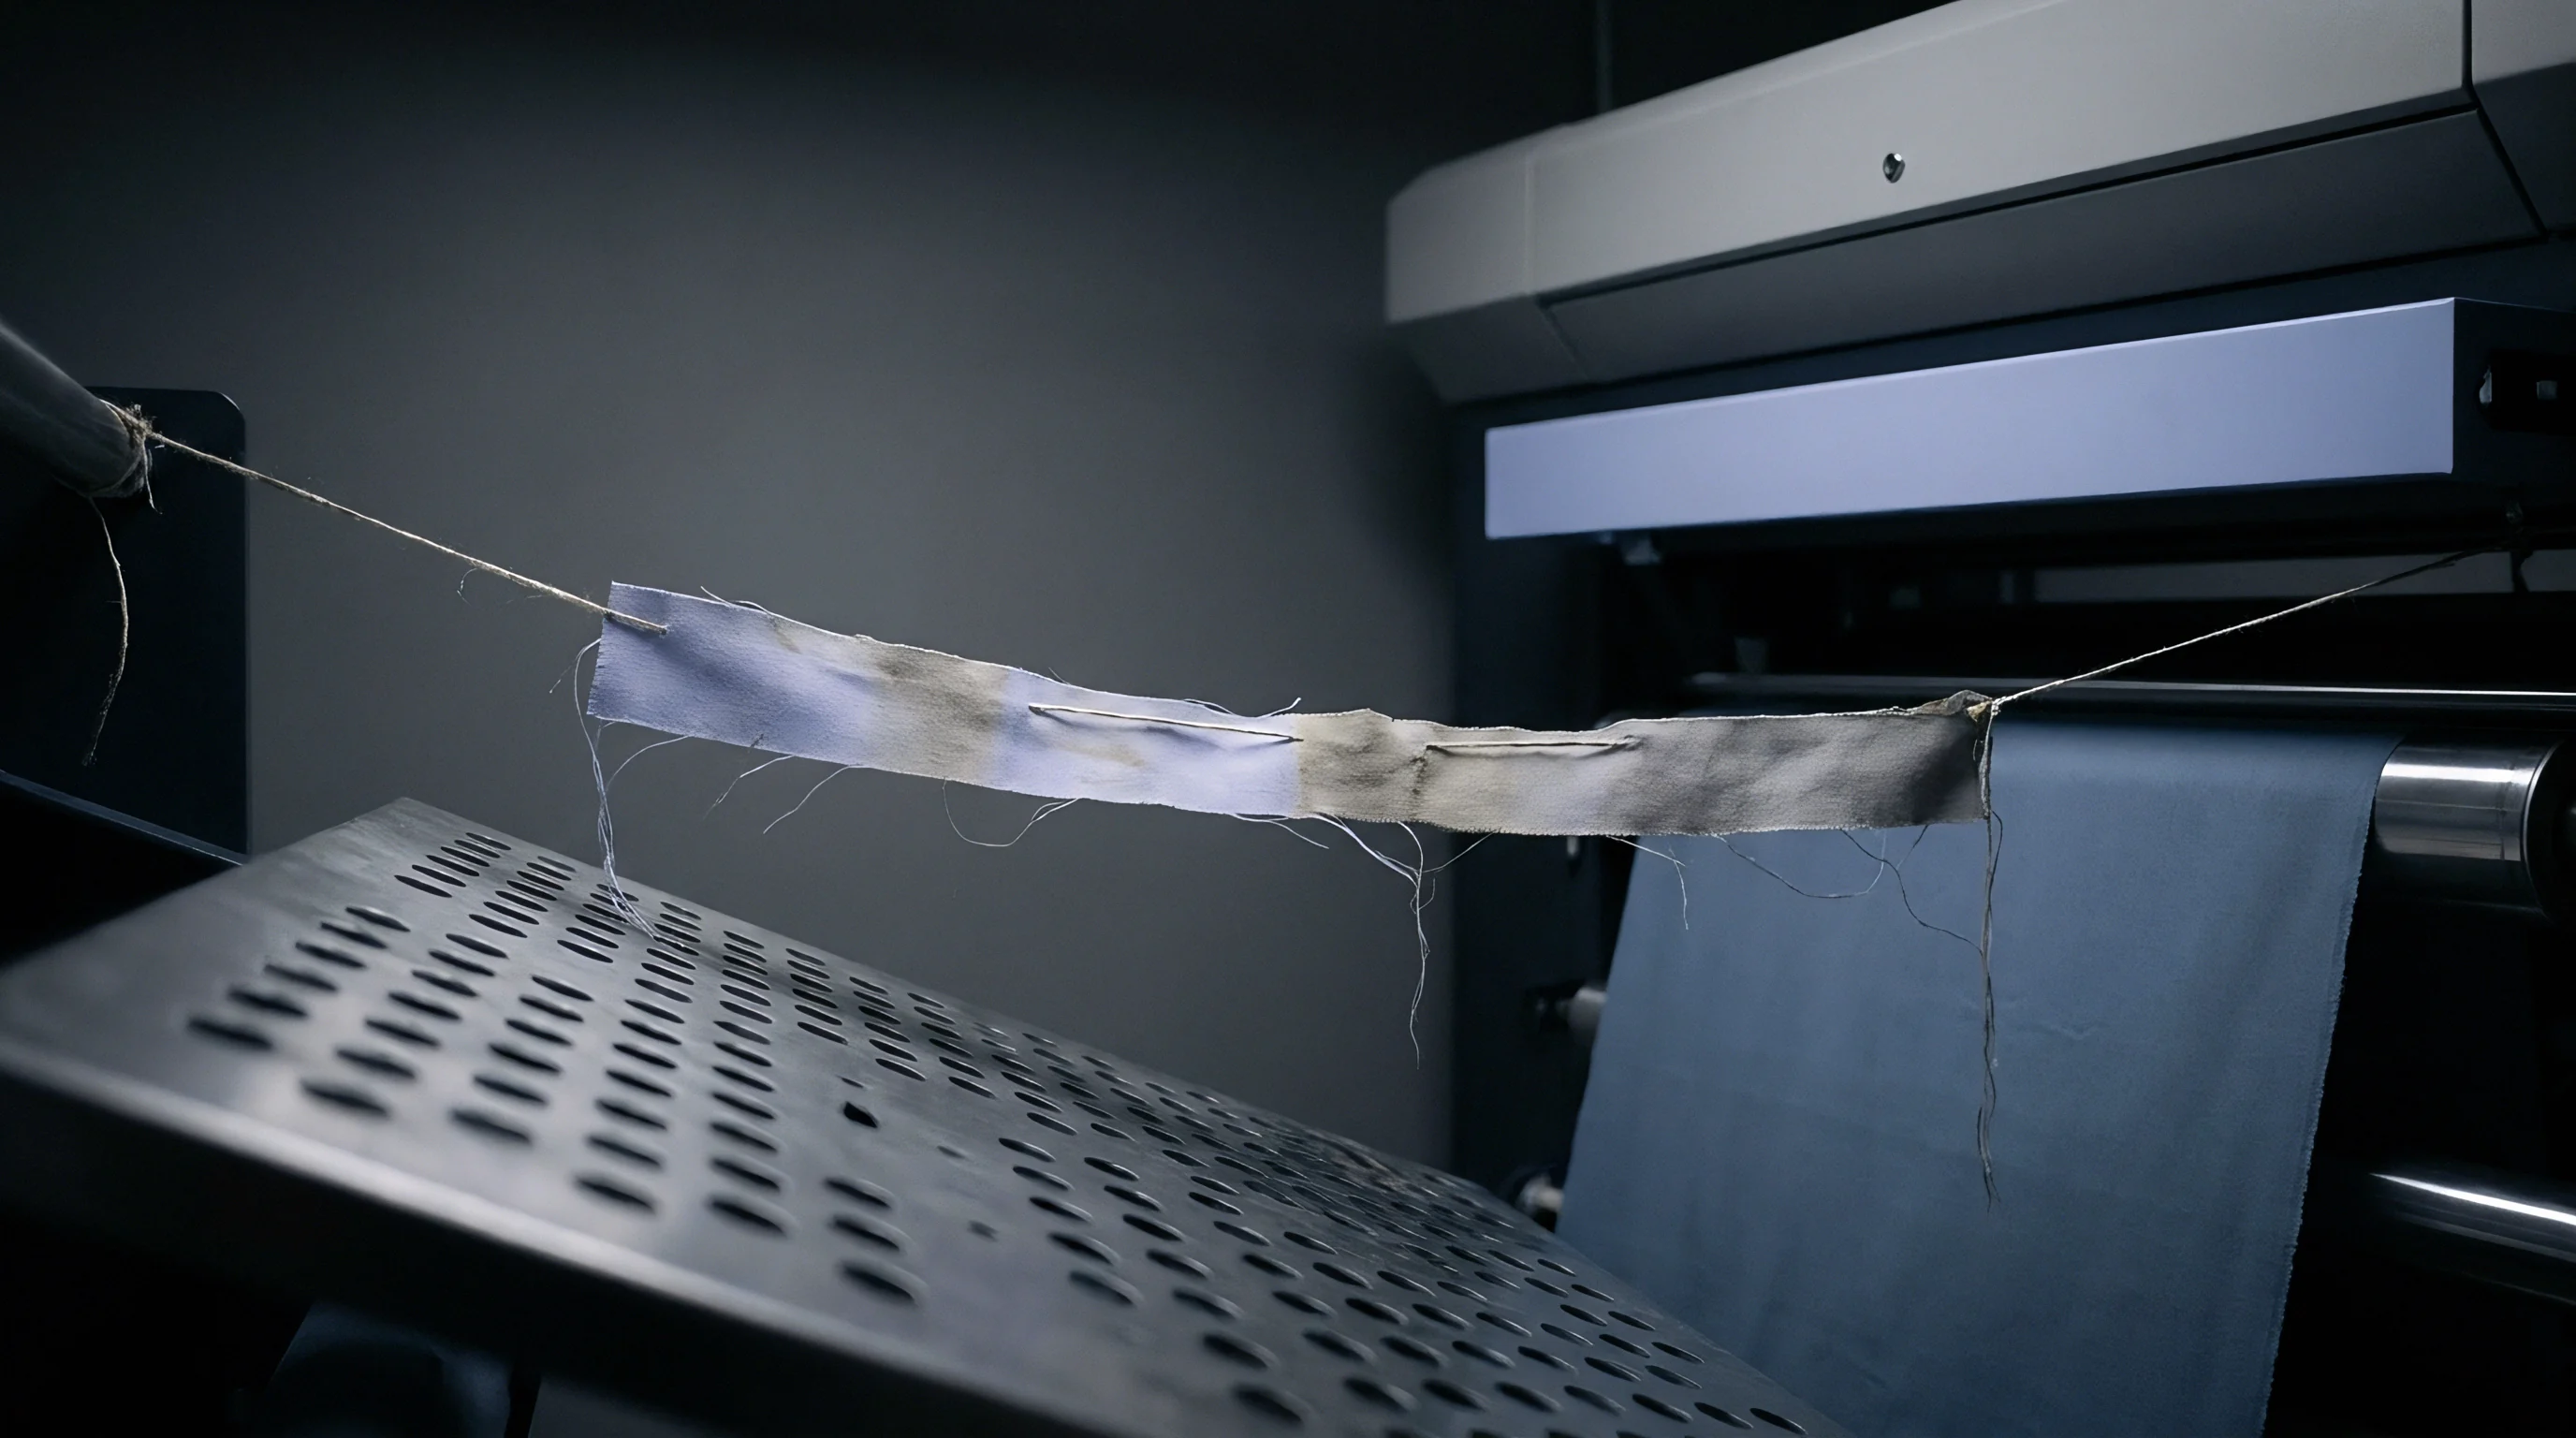
Mechanical Sources of Lateral Chemical Gradients
Differential expression across the roll nip originates from three physical conditions: elastomer hardness decay along the rubber mantle, deflection of the unbacked mandrel under pneumatic loading, and temperature accumulation in the foulard trough. Rubber sleeves operating above seventy Shore A hardness deform non-linearly under sustained hydraulic pressure. Wear patterns concentrate along the running path of standard widths, leaving the edges proud when wider lots enter the nip.
Tension drives fluid migration.
Differential drying rates inside the stenter aggravate mechanical pick-up differences. Hot air nozzles operating at two hundred meters per minute deliver higher heat transfer coefficients near the jet nozzles than across the return air ducts. Water evaporates more rapidly at the pinned edges, pulling dissolved and emulsified finishing agents outward via capillary action through the yarn interstices before thermal setting locks the polymers in place.
The final finish topography reflects both the liquid application profile and the convective drying pattern of the stenter line.
Finishing emulsions migrate toward high-heat boundaries when air velocity across stenter jet boxes varies by more than ten percent.
Chemical concentration inside the pad box shifts during long continuous runs. Hydrophobic emulsions containing organo-modified silicones or paraffin-wax dispersions experience shear destabilization in circulating troughs, leading to selective bath depletion where higher-affinity components exhaust onto the moving substrate at different rates across the liquor surface. A foulard lacking continuous replenishment controls and cross-trough circulation creates a chemical concentration gradient before the squeeze rollers exert pressure on the running substrate.


Metric
Quantitative verification of finish consistency demands analytical measurement methods that isolate the active chemical mass per unit area. Attribute inspections classifying swatches as acceptable or defective discard critical variance data needed to detect stenter drift. Continuous variables yield exact numerical datasets amenable to statistical quality evaluation under standardized acceptance procedures.
Hydrostatic head drops sharply.
The primary direct quantitative indicator for finish uniformity is solvent extraction gravimetry conducted according to ISO 14419 or ISO 3071, which determines the mass fraction of active finish deposited onto dried fiber. For silicone and hydrocarbon-based water repellents, solvent extraction with petroleum ether or hexane isolates the active finish solids from clean fiber mass. For fluorinated or mineral finishes, X-ray fluorescence spectrometry yields total elemental count intensities that correlate directly to surface deposition density without destroying the substrate.

Continuous Physical and Chemical Test Methods
Direct chemical extraction isolates the deposited molecule, while indirect functional testing evaluates performance thresholds across the roll width. Functional values drift when chemical application fluctuates across critical saturation plateaus.
| Test Method Standard | Measurement Target | Physical Unit | Lower Specification Limit | Upper Specification Limit |
|---|---|---|---|---|
| AATCC 22 / ISO 4920 | Surface Spray Wetting Resistance | Spray Rating Number | 80 (continuous scale) | 100 |
| AATCC 127 / ISO 811 | Hydrostatic Pressure Resistance | Millibar or mm H2O | 180 mm H2O | None (Single Limit) |
| ISO 14419 (Modified) | Total Solvent Extractable Matter | Percent Active Solids | 1.25 percent | 2.10 percent |
| ISO 17075-1 / Chemical Extraction | Dry Chemical Add-On Mass | Grams per Square Meter | 14.0 g/m² | 22.0 g/m² |
| DIN 54060 / AATCC 135 Area Mass | Areal Substrate Density | Grams per Square Meter | 195 g/m² | 215 g/m² |
Hydrostatic head testing under ISO 811 measures water column height resistance across specimens taken across the transverse cut. A roll exhibiting twenty-two grams per square meter dry add-on achieves three hundred millimeters of water column resistance at the left selvage. That same roll drops to one hundred and forty millimeters at the center when add-on falls to thirteen grams per square meter.
The steep non-linear response of hydrostatic resistance below fifteen grams per square meter amplifies subtle finish deficits into functional failures during commercial rainwear usage.
The laboratory runs triple extractions.
Elemental analysis via benchtop energy-dispersive X-ray fluorescence provides rapid quantitative readings on cross-web swatches. Calibrating the instrument against certified reference specimens establishes net peak intensity curves for silicon or zirconium crosslinkers. Ten-second exposures on fifty-millimeter disks cut from left, quarter, center, three-quarter, and right positions yield quantitative mass counts without the twelve-hour extraction cycles demanded by Soxhlet distillation apparatus.

Specification Limits and Transverse Partitioning
Establishing specification boundaries requires dividing the nominal width into distinct transverse testing lanes. Standard practice partitions wide goods into five discrete operational tracks across the usable width, excluding the outer fifty millimeters of pinned selvage.
- Edge specimens correspond to the outermost ten percent of usable width adjacent to the stenter pin line where air turbulence reaches maximum velocity.
- Quarter specimens represent the intermediate twenty-five percent boundary zone where nip roll core deflection transitions into rubber sleeve shear strain.
- Center specimens capture the median twenty percent longitudinal strip where hydraulic pressure reaches minimum expression during unbacked roll deflection.
Finishing mills frequently claim that normal heat transfer shifts inside drying chambers make cross-web variations uncontrollable within commercial manufacturing tolerances.


Calculus
Acceptance evaluation by variables utilizes the continuous numerical distribution of test values to compute the statistical probability that a lot meets specified tolerance limits. Compared with attribute go-or-no-go checks, variable sampling under ISO 3951-1 or ANSI/ASQ Z1.9 requires significantly fewer roll cuts to reach equivalent statistical power. This sample size economy preserves costly inventory while improving discrimination against non-conforming shipments.
Both limits govern release.
The variable acceptance mechanism operates through quality statistics derived from the sample mean and sample standard deviation. Let upper and lower specification limits be designated as USL and LSL. For an inspection lot of continuous rolls, swatches pulled across transverse positions produce individual measurement values across the sampled set.
ISO 3951-1 Table s-1 mandates an acceptance constant of 1.82 for code letter J at an acceptance quality limit of 1.0 percent under normal single inspection.
The calculation sequence evaluates conforming proportion through standardized deviation indices. The sample mean and sample standard deviation are established through standard formulas:
- Sample mean calculation establishes the central tendency of finish application across all transverse specimen positions across the selected rolls.
- Sample standard deviation derivation quantifies total dispersion, combining roll-to-roll variability and cross-web finishing gradients into a unified variance estimate.
- Upper quality statistic determination subtracts the observed sample mean from the upper specification limit and divides the remainder by the sample standard deviation.
- Lower quality statistic determination subtracts the lower specification limit from the observed sample mean and divides the difference by the sample standard deviation.
- Acceptance constant comparison checks whether calculated upper and lower quality statistics equal or exceed the required tabular value k dictated by the inspection plan.
Acceptance hinges on variance.

Is the Standard Deviation Pooled across Rolls?
Evaluating multi-roll lots introduces a choice between treating each roll as a distinct lot or pooling variance across the delivery. When an inspector cuts three transverse specimens from each of ten rolls, thirty total specimens enter the analytical pipeline. If the standard deviation is calculated across all thirty swatches directly, the estimate confounds within-roll transverse gradients with between-roll operational drifts.
| Inspection Level | Lot Size (Roll Count) | Sample Size (Rolls n) | Code Letter | Acceptance Quality Limit | Acceptance Factor (k) |
|---|---|---|---|---|---|
| Special S-3 | 26 to 150 | 4 | C | 1.5 percent | 1.15 |
| Special S-4 | 151 to 500 | 7 | E | 1.5 percent | 1.33 |
| Normal Level I | 501 to 1,200 | 15 | H | 1.0 percent | 1.65 |
| Normal Level II | 501 to 1,200 | 25 | J | 1.0 percent | 1.82 |
| Tightened Level II | 501 to 1,200 | 25 | J | 0.65 percent | 2.00 |
| Parameters based on unknown standard deviation, single sampling plan, s-method with separate bilateral limits. | |||||
Consider a practical execution example. A buyer purchases a lot of forty thousand linear meters distributed across two hundred rolls of woven polyester-cotton twill, specifying a dry chemical add-on target of 18.0 grams per square meter with a lower limit of 14.0 g/m² and an upper limit of 22.0 g/m². Under Normal Inspection Level II, Code Letter E prescribes a sample size of seven rolls.
From each roll, three swatches are cut at left, center, and right, yielding twenty-one individual analytical determinations.
The analytical team completes gravimetric extraction on all twenty-one specimens. The resulting grand sample mean calculates to 17.85 grams per square meter. The sample standard deviation across all twenty-one data points reaches 1.82 g/m².
Testing against the lower specification limit yields a lower quality statistic:
Q_L = (17.85 – 14.00) / 1.82 = 3.85 / 1.82 = 2.115
Testing against the upper specification limit yields an upper quality statistic:
Q_U = (22.00 – 17.85) / 1.82 = 4.15 / 1.82 = 2.280
Under Table s-1 for sample size seven at an AQL of 1.5 percent, the required critical acceptability constant k is 1.33. Because both Q_L (2.115) and Q_U (2.280) exceed 1.33, the lot passes variable acceptance testing. If transverse variation across the stenter had widened the standard deviation to 3.20 g/m² while maintaining the exact same mean of 17.85 g/m², Q_L would plummet to 1.203.
Under that elevated dispersion, the calculated statistic falls below the 1.33 threshold, triggering lot rejection even though the arithmetic batch average appears near nominal target.
A narrow average never compensates for a wide spread.


Bias
Field verification encounters systematic distortion when cross-web sampling patterns ignore manufacturing orientation. Transverse chemical add-on profiles rarely follow a Gaussian distribution across the roll width. Edge effects, thermal asymmetry in drying nozzles, and directional liquor flow inside the foulard pan superimpose systematic spatial patterns on random process variation.
Edge margins skew variance.
Averaging transverse readings into an unweighted single roll metric creates mathematical blind spots. When edge specimens systematically run twelve percent heavier in chemical add-on than center cuts, pooling values into a single variance equation disguises systematic machinery errors as random fiber dispersion. This masking prevents root-cause correction of stenter nozzle balances and mangle crown geometry.
A sampling plan that ignores cross-web specimen coordinates will classify mechanical roll deflection as random chemical variation.
Transverse fluid application resembles the convective mass transfer profiles encountered in papermaking fourdrinier tables, where mechanical suction boxes generate lateral moisture variations through localized wire deflection. Similar physics govern textile mangle bowls, where boundary layer shearing near the roll shoulders alters hydrodynamic pressure across the contact zone.

Are Paired Edge Specimens Statistically Independent?
Spatial correlation across the continuous sheet violates the fundamental independence assumption underlying standard variable sampling mathematics. Left and right selvages share mechanical exposure to pin chain guides, edge trimmers, and hot air exhaust plenums. Consequently, specimens collected from opposed edges of the same transverse cut exhibit covariance that invalidates simple random sampling equations.
- Positional nesting isolates within-roll transverse gradients from roll-to-roll temporal shifts via two-way analysis of variance before quality index estimation.
- Extreme-value tracking applies acceptance criteria directly to the transverse range vector, flagging rolls whose edge-to-center delta exceeds thirty percent of the total tolerance band.
- Weighted vector mapping applies distinct acceptability constants to edge, quarter, and center coordinates to prevent systematic center starvation from passing under aggregate lot averaging.
Moisture meters read wet margins.
In water-repellent finishing, the exact correlation length of finish variations across an 1800-millimeter web cannot be defended from published literature because fluid dynamics in the nip change with substrate construction, yarn twist, and line speed. Faced with this uncertainty, careful sourcing engineers reject aggregated lot pooling and mandate separate variable acceptance evaluations for edge lanes and center lanes. This dual-track calculation isolates systematic equipment bias from base lot dispersion.
Whether stenter drying airflow variations create equal variance across both faces of double-sided finished cloth remains an open operational question.

Friction
When a variable sampling plan flags a finish uniformity failure, commercial tension between converter, finish supplier, and apparel brand centers on who carries the financial burden. The chemical manufacturer points to mechanical padding deficiencies at the mill. The dyeing and finishing mill claims the chemical batch arrived off-spec.
The garment manufacturer faces delayed production schedules and retail delivery cancellation windows.
Defective yardage commands full credit.
Attribute inspection disputes drag on for months because subjective spray rating photographs allow endless visual reinterpretation. Conversely, variable sampling protocols founded on continuous physical units such as grams per square meter add-on or millibars of hydrostatic head yield unambiguous proof of non-conformity. A quality statistic failing the critical acceptance value k provides irrefutable contractual grounds for rejecting containerized shipments at destination ports.
Standard commercial purchase orders stipulate that variable sampling re-tests require joint laboratory witnessing with expenses assessed against the losing party.
Traceability dossiers must accompany variable sampling rejections to withstand commercial arbitration. The verification dossier combines stenter log charts, calibrated X-ray fluorescence spectra, solvent extraction gravimetric logs, and certified swatch location maps. Without exact cut-coordinate tracking on every swatch, the supplier successfully challenges the independence of the specimen set.
Tolerance defines the penalty.
Failure to implement variable acceptance sampling on functional finishes exposes the importer to consumer product field failures, warranty chargebacks, and regulatory recalls when water or chemical barriers fail unevenly across finished garments.