Spectrophotometric Shade Consistency Management across Split Dyeing Production Batches
Split dyeing batch shade consistency depends on spectrophotometric reflectance curve matching across multiple illuminants and strict stenter thermal control.

Vat
Exhaust and Continuous Wet Processing Variables
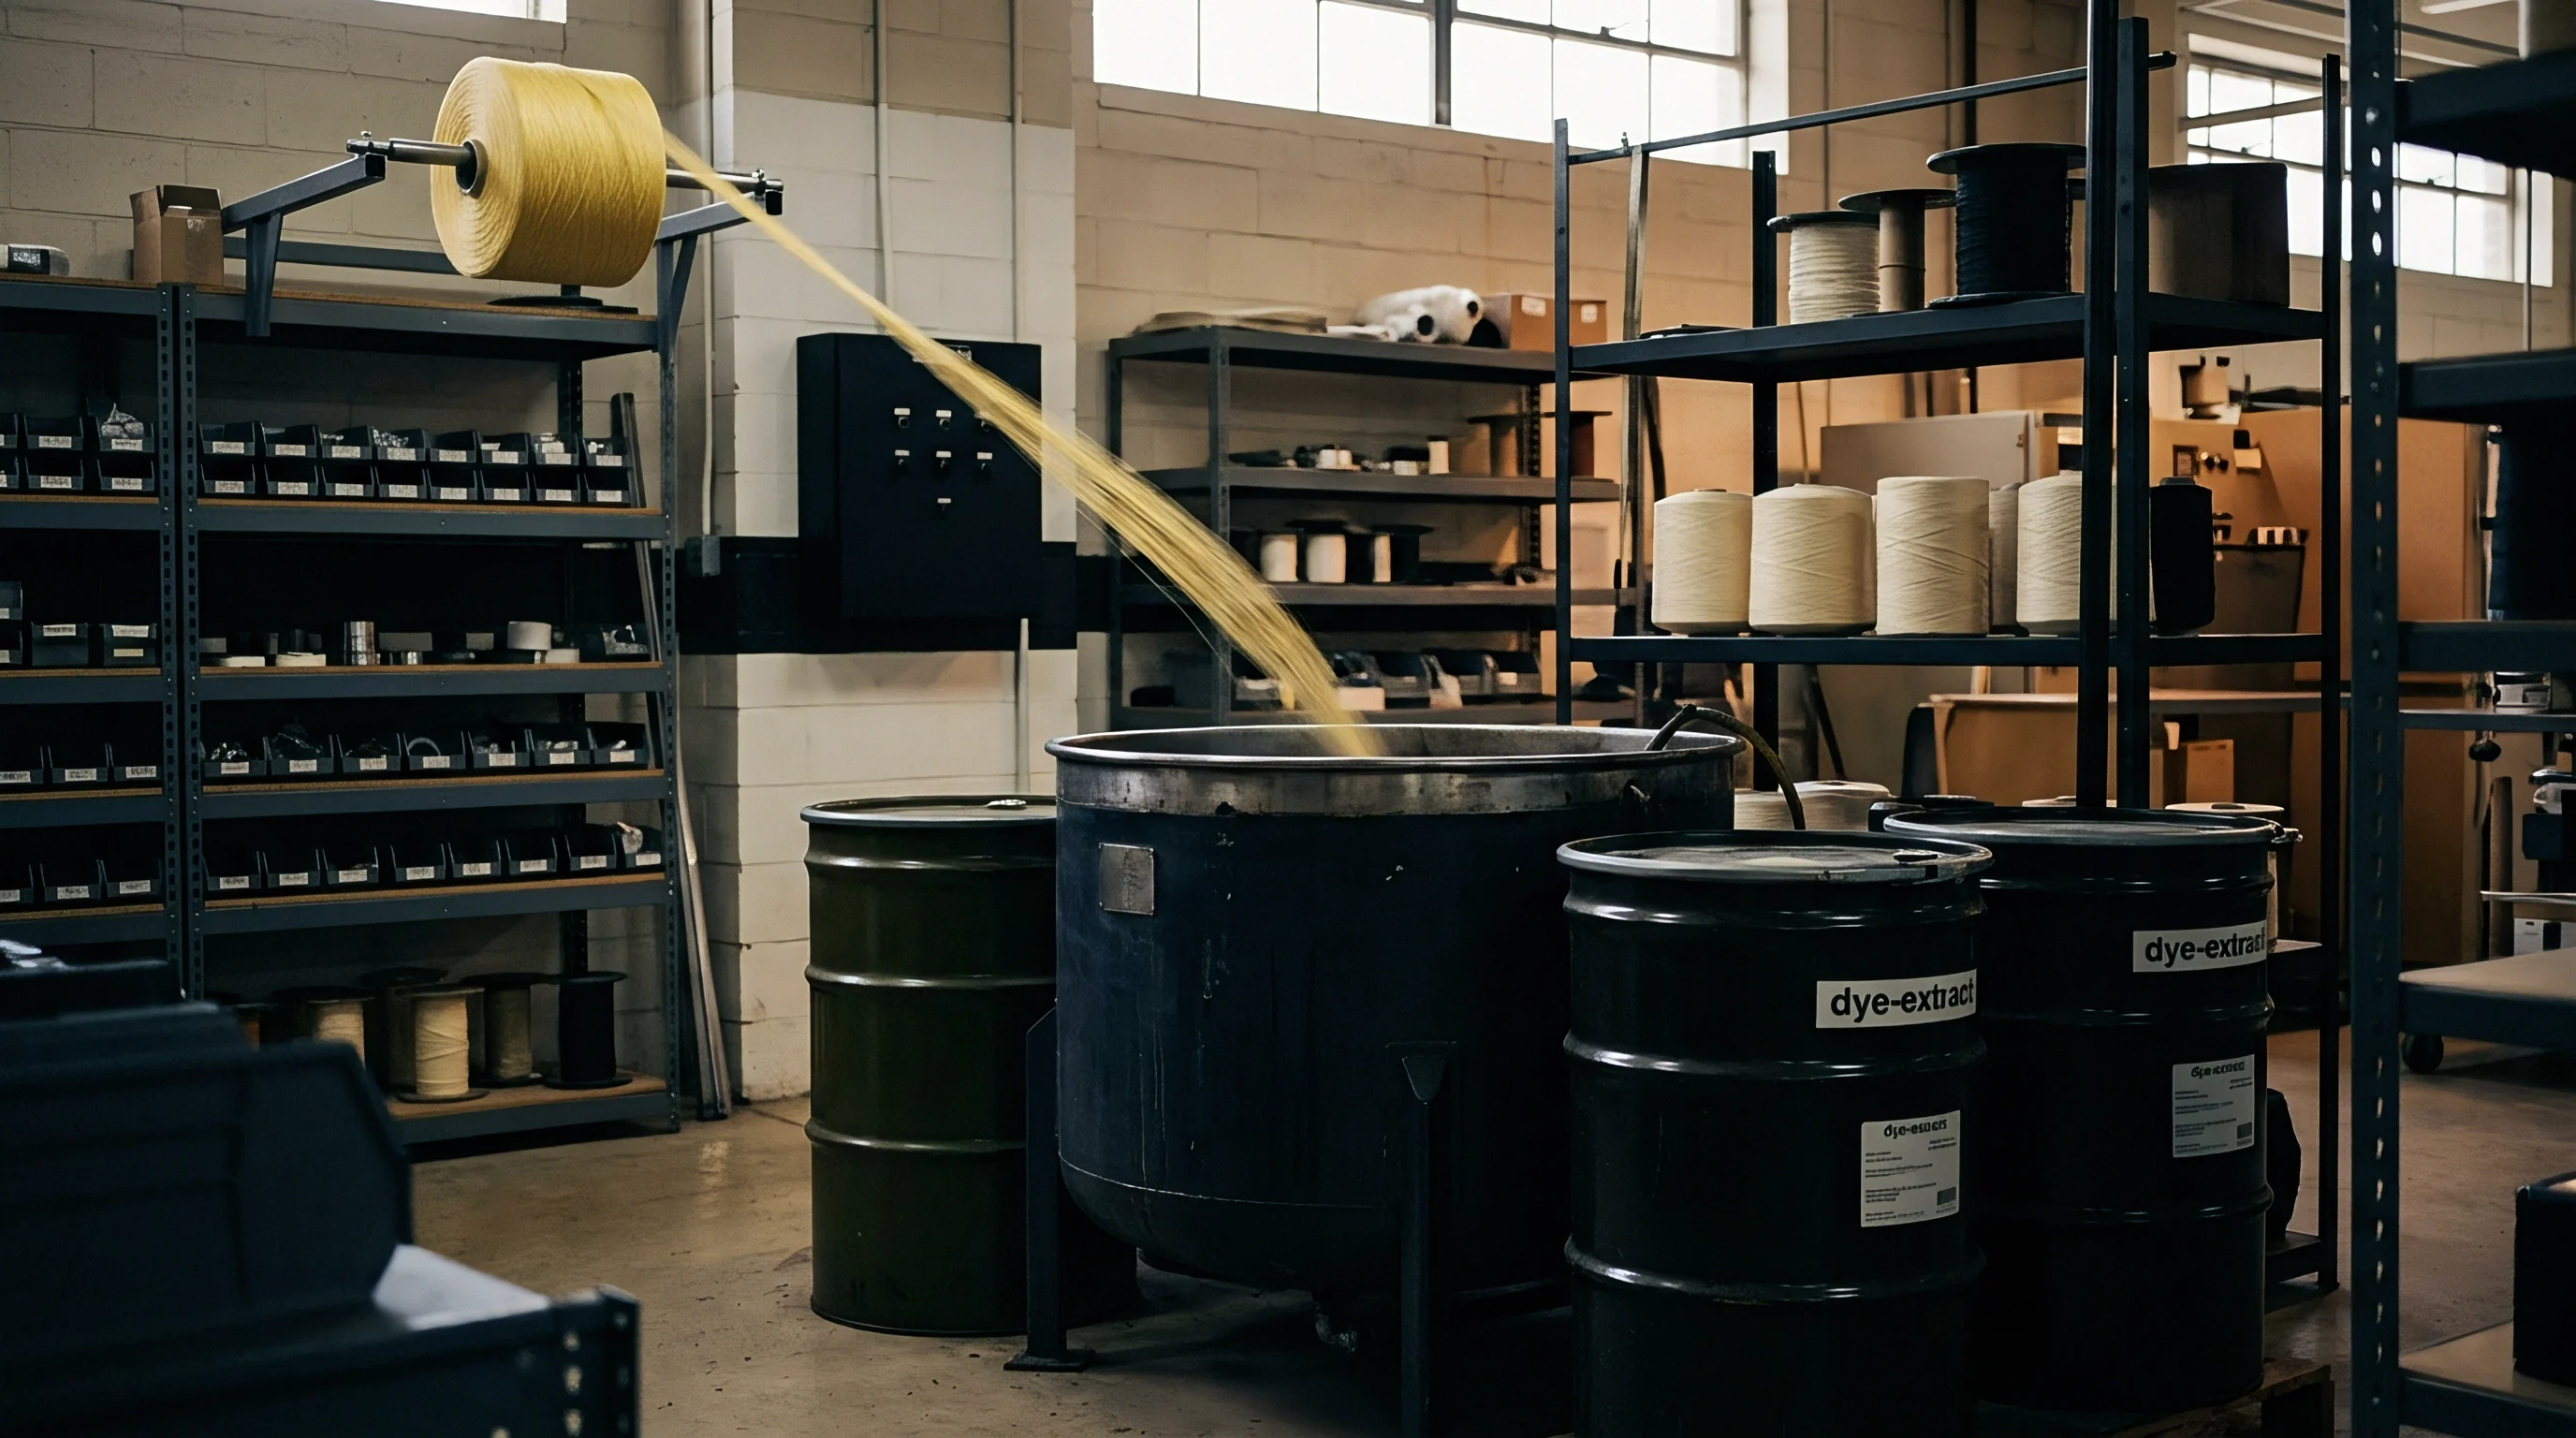
Splitting a single production order across multiple dyeing vessels introduces chemical and mechanical variables that alter spectral reflectance curves, even on identical dye recipes. Fluid dynamics inside an atmospheric jet machine differ fundamentally from those in a high-temperature package unit or a continuous pad-steam range. Liquor ratio is usually where divergence starts.
A jet vessel operating at a 1:8 liquor-to-goods ratio transfers dye onto yarn or fabric at a rate set by bath exhaustion dynamics, flow velocity, and circulation cycles per minute. If a secondary batch runs in a vessel at 1:10, the chemical equilibrium of reactive or disperse dyes shifts, changing total dye uptake by 3 to 7 percent across the visible spectrum.
Mechanical shear forces inside the vessel also rearrange surface fibers. High liquor velocity compresses surface pile on brushed knits and textured wovens, changing how light scatters off the face of the finished fabric. While a dyer balances bath volume, pH, salt concentration, and temperature ramp rates, minor thermal gradients across heating coils still produce micro-variations in dye fixation.
In reactive dyeing of cellulose, bath alkalinity drives hydrolysis right alongside fixation. A shift of just 0.1 pH units between split dye baths alters how much hydrolyzed dye fails to bond with the fiber matrix, changing color yield and chromaticity values before soaping off.
Uncontrolled bath exhaustion leaves un-complexed dye sitting on the fiber surface, forcing rigorous post-dye washing. Wash-off procedures themselves vary from machine to machine. Differences in water temperature, rinse cycles, and surfactant concentration during neutralization alter residual hydrolysate levels.
Unfixed dye left behind shifts spectral reflectance under ultraviolet and short-wavelength visible light. Sourcing records confirm that split lots processed on non-identical jet units show distinct Delta E values despite matching dye dosing schedules.
Commercial shade continuity fails when split dye baths vary by more than 0.15 pH units or experience liquor ratio fluctuations exceeding five percent during the primary fixation window.
Substrate Variability across Greige Splitting
Greige fabric structure sets the baseline light absorption and reflection capacity of the substrate. When bulk greige is divided across dyeing lots, variations in yarn lot history, twist density, and fiber maturity show up as shade non-uniformity. Cotton fibers vary in micronaire across agricultural bales; low-micronaire fibers have thinner cell walls, taking up less dye and reflecting light differently than mature, thick-walled fibers.
In synthetic yarns like polyester or nylon, differences in filament cross-sectional geometry, draw ratio, and micro-void density change internal light refraction, shifting the perceived depth of shade.
- Mechanical desizing bath monitoring must track starch removal efficiency through iodine titration tests across every greige lot before wet processing.
- Alkaline scouring processes require continuous monitoring of sodium hydroxide concentration to prevent uneven fiber swelling that alters dye site accessibility.
- Peroxide bleaching protocols must maintain total organic carbon levels below threshold limits to avoid oxidative damage that shifts white base whiteness indices.
- Heat-setting operations prior to dyeing must lock fabric width and fiber crystallinity within a two-degree Celsius window across all split rolls.
Fabric density controls how deep light penetrates the weave or knit matrix. A dense woven poplin with 120 ends per inch and 80 picks per inch leaves tighter inter-yarn spaces than an open 100 ends per inch construction. Light entering the dense structure scatters internally multiple times, raising the probability of dye molecule absorption.
If greige split lots come from different weaving sheds or looms with mismatched warp tension settings, local thread density varies. Those tension differences alter yarn crimp, altering surface geometry and distorting spectrophotometric measurements even when dye absorption per gram of fiber is identical.
Audits across three production facilities showed that split lots of 100 percent combed cotton single jersey yielded Delta E CMC values exceeding 1.40 solely due to uncalibrated vessel flow rates between twin jet systems. The dyehouse had assumed identical mechanical programs produced identical spectral curves across different machine capacities.
Which mechanical calibration factors contribute most to inter-vessel shade drift across split production runs?
Geometry

Spectrophotometric Measurement Conditions and Optics
Color measurement precision depends on the optical setup of the measuring instrument. Sphere spectrophotometers operating with diffuse illumination and 8-degree viewing angles (d/8) capture spectral reflectance by diffusely illuminating the sample inside an integrating sphere coated with barium sulfate or synthetic white material. Specular component included (SCI) mode captures total reflectance, incorporating both specular surface glare and diffuse internal reflection.
Specular component excluded (SCE) mode uses optical traps to absorb surface glare, isolating shade differences caused by surface texture and gloss variations. Selecting the wrong optical mode causes split-batch inspection failures on fabrics with complex surface topographies.
| Optical Configuration | Aperture Size | Specular Component | UV Filter Status | Substrate Application | Target Measurement Variance |
|---|---|---|---|---|---|
| d/8 Sphere | 25 mm (LAV) | Included (SCI) | 100% UV Included | Fluorescent Brightened Cottons | Under 0.08 Delta E CMC |
| d/8 Sphere | 14 mm (MAV) | Excluded (SCE) | UV Cut-off 400 nm | Micro-denier Synthetic Wovens | Under 0.12 Delta E CMC |
| 45/0 Directional | 10 mm (SAV) | Excluded (SCE) | UV Cut-off 420 nm | High-Gloss Coated Fabrics | Under 0.15 Delta E CMC |
| d/8 Sphere | 30 mm (XAV) | Included (SCI) | UV Calibrated (D65) | Textured Double Knits | Under 0.05 Delta E CMC |
| Data compiled under ISO 105-J01 standard test conditions at 21 degrees Celsius and 65 percent relative humidity. | |||||
Aperture selection controls sample surface area coverage per measurement flash. Large Area View (LAV) apertures averaging 25 mm diameter smooth out local structural variations in coarse knits and slub yarns by integrating reflectance over a wider surface. Small Area View (SAV) apertures measuring 6 mm to 10 mm capture microscopic yarn density shifts, increasing measurement variance across split production rolls.
When inspecting split batches, using mismatched aperture sizes between the mill laboratory and the buyer incoming quality control desk renders Delta E comparison data invalid. Instrumental repeatability requires consistent sample folding, orientation, and clamping pressure across all measurement stations.
Substrate Handling and Measurement Execution
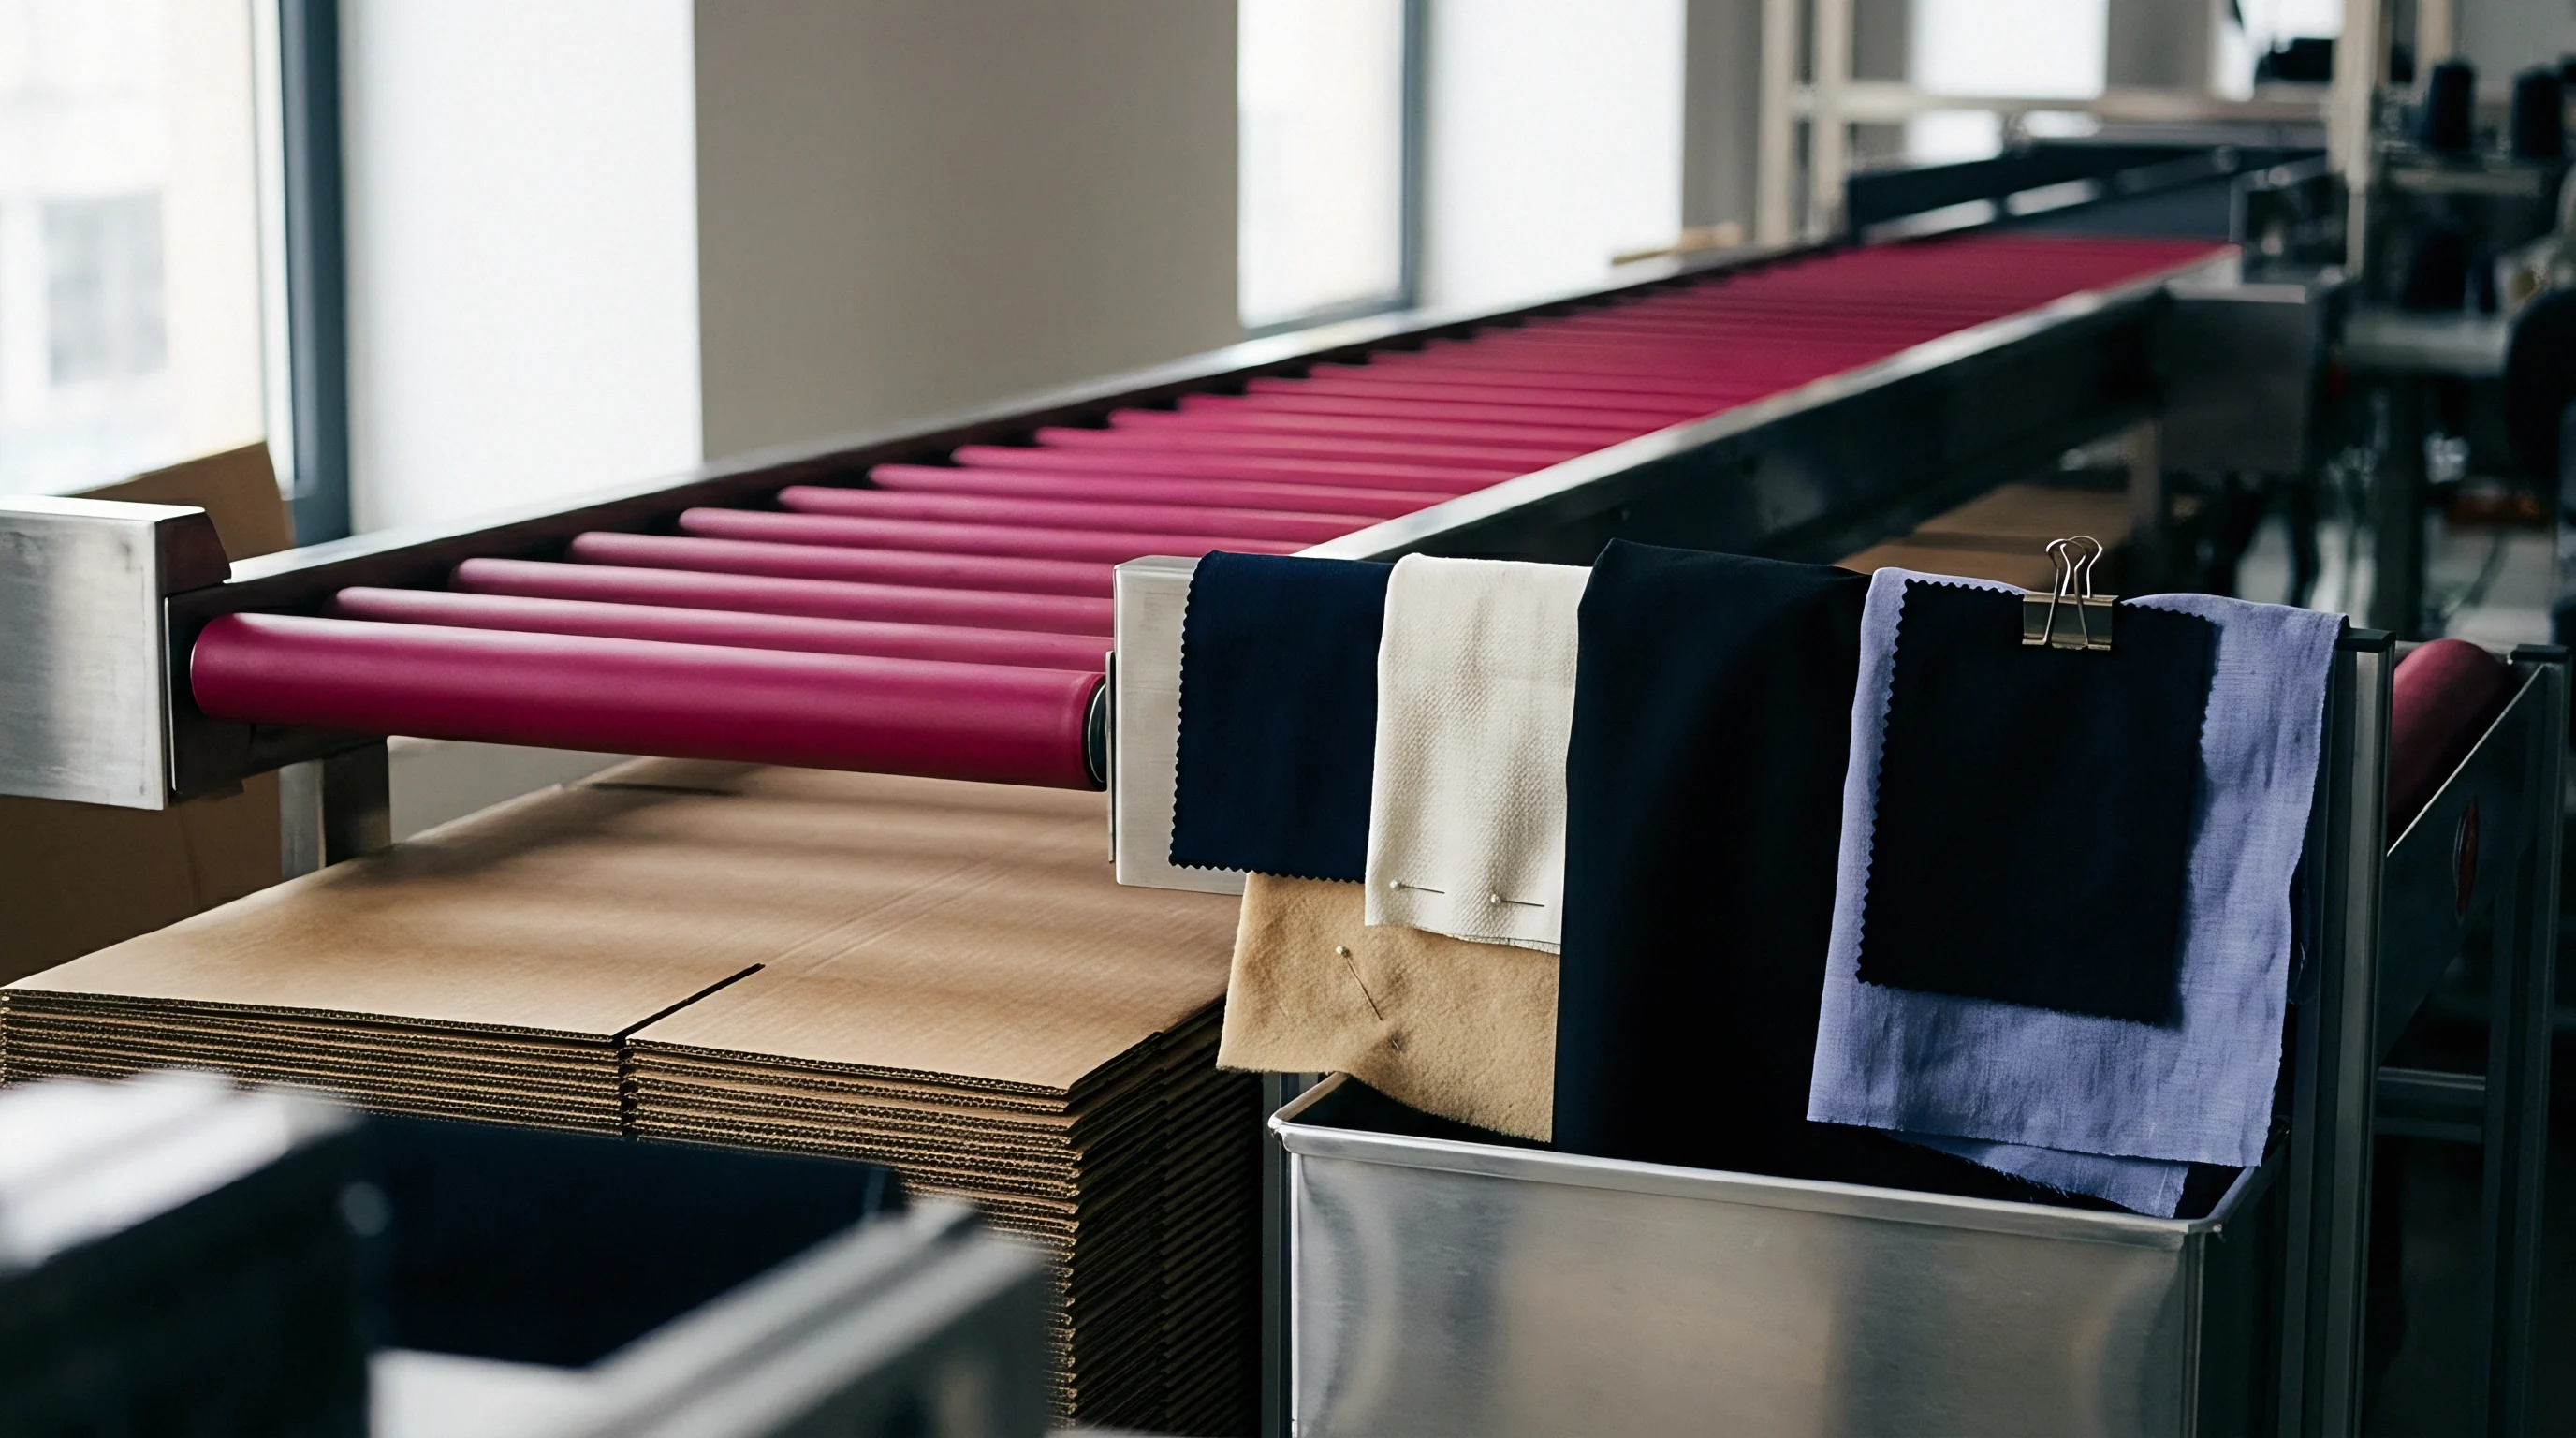
Fabric sample preparation directly governs spectral data integrity during spectrophotometric evaluations. Non-opaque textile samples allow light to penetrate through the fabric layer, reflect off the instrument sample holder background, and return to the optical detector, generating false reflectance values. Technologists prevent light leakage by folding woven fabric into four layers or knits into eight layers until the sample achieves optical opacity, verified when adding further layers yields zero change in spectral reflectance curves.
- Optical Opacity Verification must confirm that adding additional fabric thickness layers yields zero change in spectral reflectance values across 400 nm to 700 nm wavelengths.
- Sample Rotation Protocol requires rotating the fabric sample 90 degrees between four consecutive spectrophotometric flashes to average out directional warp and weft alignment effects.
- Standardized Clamping Force demands calibrated pneumatic sample holders to prevent local fabric compression that alters yarn density during optical measurement.
- UV Calibration Maintenance mandates regular verification of xenon flash lamps using calibrated fluorescent standards to ensure consistent UV excitation of optical brighteners.
Optical brighteners skew reflectance data. Substrates treated with optical brightening agents absorb light in the ultraviolet spectrum (340 nm to 380 nm) and re-emit energy in the visible blue spectrum (420 nm to 460 nm). Spectrophotometers measuring brightened fabrics must use UV-calibrated light sources with motorized UV-cut filters.
If split production batches undergo testing on instruments with uncalibrated UV lamps, measured blue-axis chromaticity values drift significantly, falsely indicating shade mismatches between batches that visually match under standard viewing cabinet lighting.
Under ISO 105-J01, optical measurement data collected without specifying aperture size, illumination geometry, and specular component inclusion status holds no legal validity in commercial shade arbitration disputes.
Surface texture alters diffuse reflection pathways. The rule of thumb dictates that high-luster synthetic fabrics require SCI mode to separate true dye concentration from surface sheen, whereas matte natural fibers demand SCE mode to replicate visual inspection conditions. Instrument optics must remain locked across supply chain tiers to prevent systemic measurement offset between dyehouses and cutting facilities.

Formulas

Color Difference Equations and Ellipsoid Tolerancing
Evaluating shade consistency across split dyeing batches requires mathematical models that map non-uniform human visual perception into uniform color space geometry. The traditional CIELAB color space calculates total color difference using Euclidean distance across three orthogonal axes: L for lightness, a for red-green balance, and b for yellow-blue balance. CIELAB Delta E equations treat tolerance zones as perfect spheres of uniform radius across the entire color space.
Human vision exhibits variable sensitivity depending on color saturation and hue angle, rendering spherical tolerances inadequate for precise commercial shade pass/fail decisions.
The CMC (Color Measurement Committee) equation resolves non-uniform visual perception by constructing semi-ellipsoidal tolerance volumes around target color coordinates. The CMC formula applies weighting factors for lightness (l) and chroma (c), producing the ratio l:c. In textile applications, a 2:1 ratio (CMC l:c = 2:1) halves lightness weighting relative to chroma, allowing wider lightness variation while strictly constraining hue and chroma drift.
This ratio mirrors human visual tolerance in apparel fabrics, where minor lightness variations between garments are far more acceptable than subtle shifts in hue tone.
| Shade Category | Color Space Metric | Illuminant D65 (Daylight) | Illuminant F02 (CFL) | Illuminant A (Tungsten) | Commercial Pass/Fail Threshold |
|---|---|---|---|---|---|
| Critical Neutral Gray | CMC (2:1) | Delta E < 0.60 | Delta E < 0.50 | Delta E < 0.55 | Strict Match (Tier 1 Apparel) |
| Critical Neutral Gray | CIEDE2000 (1:1:1) | Delta E00 < 0.45 | Delta E00 < 0.40 | Delta E00 < 0.42 | Strict Match (Tier 1 Apparel) |
| High-Saturation Red | CMC (2:1) | Delta E < 1.20 | Delta E < 1.10 | Delta E < 1.15 | Standard Commercial Match |
| High-Saturation Red | CIEDE2000 (1:1:1) | Delta E00 < 0.85 | Delta E00 < 0.80 | Delta E00 < 0.82 | Standard Commercial Match |
| Pastel Beige | CMC (2:1) | Delta E < 0.75 | Delta E < 0.65 | Delta E < 0.70 | High Sensitivity Zone |
| Pastel Beige | CIEDE2000 (1:1:1) | Delta E00 < 0.55 | Delta E00 < 0.48 | Delta E00 < 0.50 | High Sensitivity Zone |
CIEDE2000 represents the most mathematically refined color difference calculation method standardizing modern industrial shade pass/fail protocol. CIEDE2000 incorporates specific rotation terms (RT) to address ellipse behavior in the blue region, alongside parametric correction factors for lightness, chroma, and hue (SL, SC, SH). The formula corrects for the non-linear interaction between hue and chroma at high saturation levels.
When evaluating split dyeing production batches, reliance on unweighted CIELAB Delta E calculations leads to premature lot rejections in yellow hues or false acceptances in neutral grays.
When two split fabric lots match under primary daylight illumination but flare into distinct shades under store lighting, metamerism has occurred. Technologists quantify metamerism using the Metamerism Index (MI), calculated as the visual color difference between two samples under a secondary illuminant (such as store fluorescent F02 or F11) after matching them mathematically under the primary illuminant (typically daylight D65).
Worked Case Calibration Analysis
Mathematical modeling of split dyeing batch variations illustrates how choice of color difference equation directly dictates factory yield and landed delivery schedules. Consider a high-volume apparel program executing a 50,000-meter split order across two separate dyeing facilities. Batch A produces 25,000 meters of navy blue twill at Mill 1.
Batch B produces the remaining 25,000 meters at Mill 2. The approved master standard reflectance data provides baseline L a b values of L = 18.42, a = 1.15, b = -6.85 under illuminant D65, 10-degree standard observer.
Mill 1 yields spectrophotometric readings of L = 18.80, a = 1.35, b = -6.40. Mill 2 yields readings of L = 18.10, a = 0.90, b = -7.30. Evaluating these batches using standard Euclidean CIELAB Delta E formulas yields:
For Batch A: Delta L = +0.38, Delta a = +0.20, Delta b = +0.45. Calculating Euclidean distance gives Delta E ab = sqrt(0.38^2 + 0.20^2 + 0.45^2) = 0.62.
For Batch B: Delta L = -0.32, Delta a = -0.25, Delta b = -0.45. Calculating Euclidean distance gives Delta E ab = sqrt((-0.32)^2 + (-0.25)^2 + (-0.45)^2) = 0.60.
Comparing Batch A directly to Batch B yields inter-batch variance delta values of Delta L = 0.70, Delta a = 0.45, Delta b = 0.90. Inter-batch Euclidean Delta E ab equals sqrt(0.70^2 + 0.45^2 + 0.90^2) = 1.22. If the procurement specification stipulates a maximum allowable inter-batch Delta E ab of 1.00, the shipment fails incoming quality control, triggering lot quarantine and cutting line downtime.
Recalculating the identical spectral reflectance data through the CMC (2:1) equation changes the pass/fail determination entirely. The ellipsoidal weighting functions for navy shades expand lightness tolerance (l=2) while tightening hue and chroma limits. Under CMC (2:1), Batch A against master standard yields Delta E CMC = 0.48.
Batch B against master standard yields Delta E CMC = 0.44. The inter-batch Delta E CMC between Batch A and Batch B calculates to 0.88.
Because the CMC (2:1) model aligns accurately with human visual perception of dark, saturated navy hues, the 0.88 inter-batch value sits safely within the commercial tolerance threshold of 1.00 Delta E CMC. Calculating the same split data using CIEDE2000 yields an inter-batch Delta E00 of 0.72. The choice of equation converts a rejected 50,000-meter split order into an accepted, commercially compliant delivery.
- Unweighted CIELAB Spherical Failure Mode occurs when linear chromaticity drift triggers false rejection of commercially acceptable high-chroma dyeings.
- Hue Rotation Instability in Blue Regions manifests when traditional Delta E formulas miscalculate hue shift magnitude near 270-degree hue angles.
- Secondary Illuminant Metameric Flare happens when dye recipe components possess mismatched spectral absorption bands under narrow-band tri-phosphor light sources.
- Parametric Weighting Mismatch arises when testing technical apparel fabrics under 1:1 ratio settings designed for high-precision plastic components.
Metameric flares introduce severe downstream assembly errors when cut panels from split batches are intermixed on sewing lines. Cut panels from two split dye lots that match under D65 daylight can shift toward opposite red-green directions under retail store LED lighting (illuminant HP7), forcing complete re-sorting and manual panel-matching of 14,000 finished jackets after garment sewing is completed.

Drift

Thermal and Chemical Finish Impact on Spectral Curves
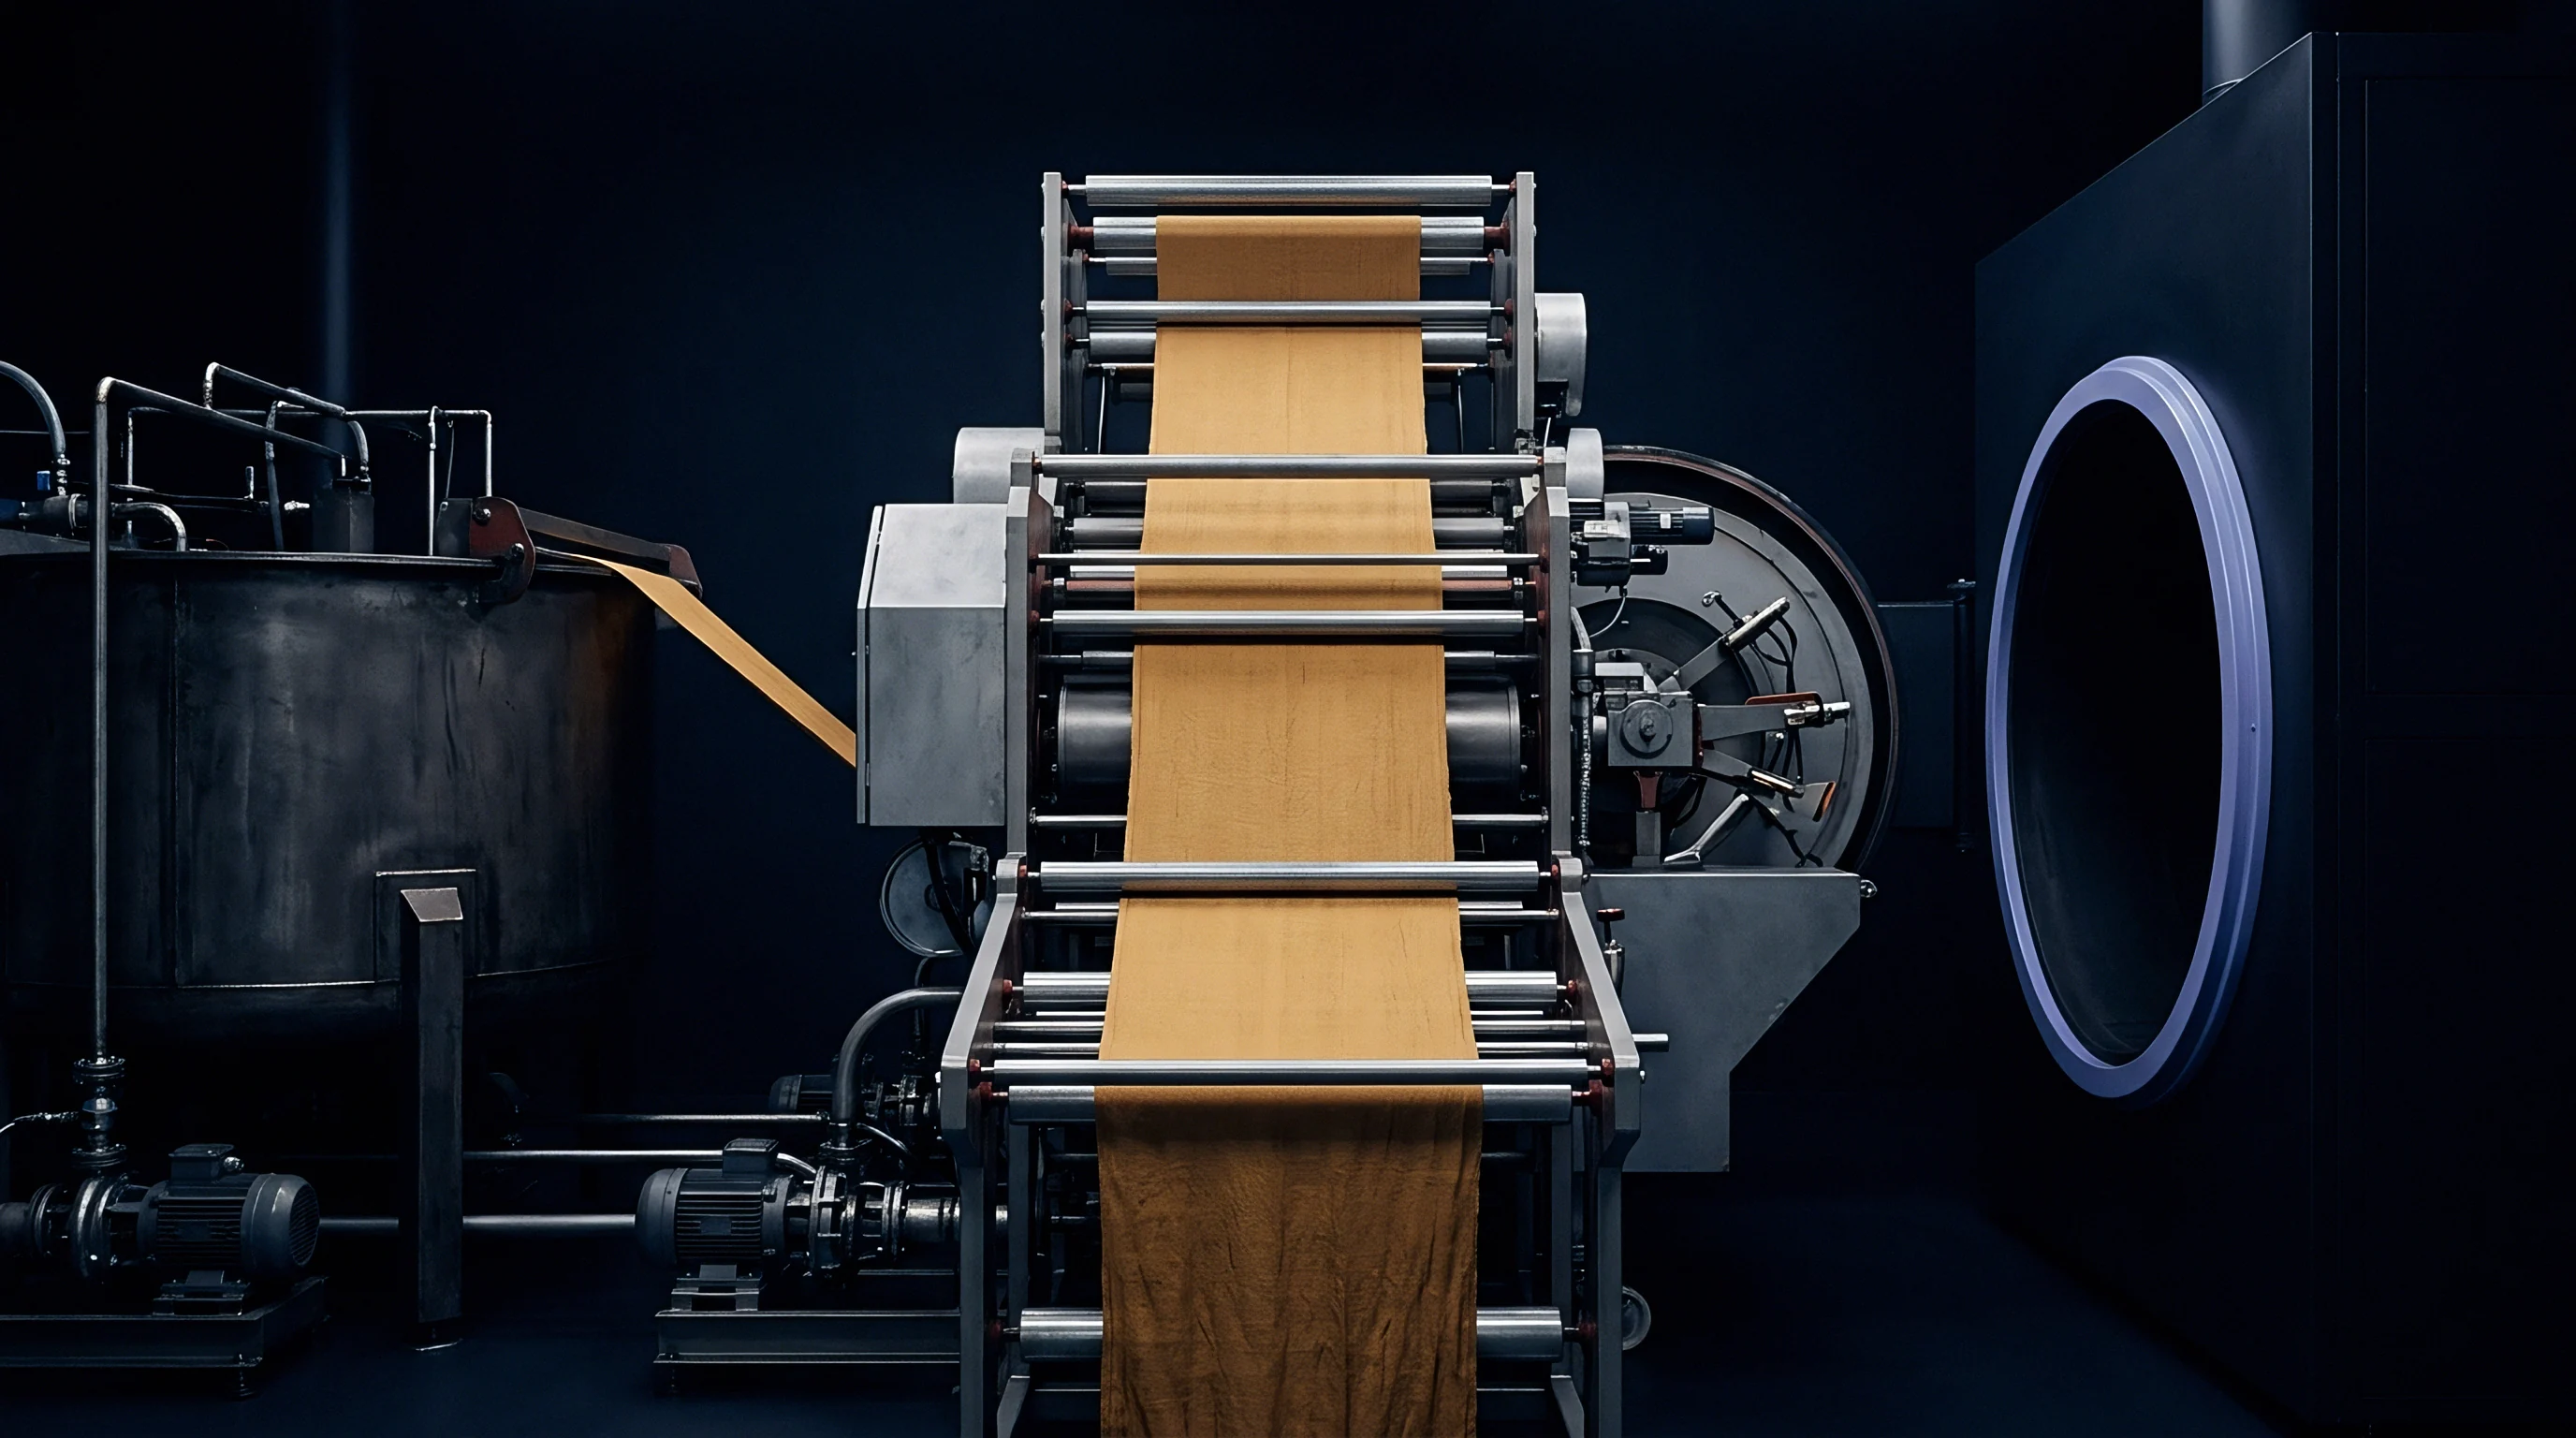
Fabric shade is not permanently locked at the exit of the dye vessel. Post-dyeing operations, particularly stenter frame drying, thermal heat setting, and functional finish applications, induce substantial spectral drift. Stenter frames expose wet-processed cloth to elevated temperatures ranging from 150 to 190 degrees Celsius for durations between 30 and 90 seconds.
Thermal energy triggers physical and chemical changes within dyed fibers. In synthetic materials like polyester, excess heat causes disperse dye molecules to undergo sublimation or thermal migration from the interior polymer matrix to the fiber surface, altering light absorption efficiency and shifting shade lightness and chroma.
Chemical finishes introduced during padding operations modify surface refractive index. Durable water repellent (DWR) fluorocarbon or silicone emulsions form micro-thin polymer films over individual fibers. These coatings alter light scatter, typically darkening the apparent shade by 0.3 to 0.8 L units while reducing overall color saturation.
If split dyeing batches pass through finishing lines with minor variations in bath pick-up rates, drying temperatures, or chemical concentrations, final spectral curves diverge even if the fabrics left the dye vessels with identical Delta E values.
| Finishing Stage | Process Parameters | Substrate Fiber Type | Primary Spectral Shift Axis | Average Delta E CMC Drift | Mitigation Strategy |
|---|---|---|---|---|---|
| High-Temp Heat Setting | 185 C for 45 seconds | 100% Textured Polyester | L Decrease (Darkening) | 0.55 – 0.90 | Pre-sublimation dye selection |
| Fluorocarbon DWR Pad | 160 C cure, 70% wet pick-up | 100% Nylon 6,6 Woven | L Decrease, b Shift | 0.40 – 0.75 | Standardized pad pressure control |
| Resin Anti-Crease Cure | 150 C cure, DMDHEU resin | 100% Combed Cotton Woven | a Shift (Yellowing) | 0.60 – 1.10 | Low-yellowing catalyst systems |
| Calendering (Schreiner) | 180 C, 40 N/mm2 pressure | 100% Cotton Down-proof | L Decrease, Gloss Increase | 0.80 – 1.40 | Locked roll temperature and speed |
Resin finishing of cellulosic fibers introduces severe yellowing risks if curing parameters fluctuate across split production lots. Dimethyloldihydroxyethyleneurea (DMDHEU) resin systems require acid catalysts and elevated curing temperatures to induce cross-linking between cellulose polymer chains. Over-curing or uneven acid catalyst concentration generates localized yellowing, driving positive b drift.
When split lots undergo resin curing on different finishing frames, minor thermal profile variations across stenter zones produce systematic shade gradients from edge-to-middle-to-edge and roll-to-roll.
Finish application must be locked into the initial lab dip approval loop. Applying a DWR or soft-resin finish to bulk production fabric without adjusting the baseline spectrophotometric target to mirror finish-induced dark shift leads to false rejection of correct dyeings during post-dyeing inspections.
Stenter dwell time and temperature profiles must remain locked across split finishing lots to prevent uneven dye sublimation and resin yellowing.
When Do Spectral Curves Diverge across Dye Batches?
Spectral curves diverge when dye molecules within split production lots experience differences in chemical structure, orientation, or environmental interaction. Divergence occurs at specific wavelength bands when dye formulation components possess non-identical extinction coefficients under changing light spectra. When dyehouses blend three primary dyes (yellow, red, blue) to produce compound shades like olive drab or neutral gray, minor variations in individual dye exhaustion rates alter the spectral profile.
Spectrophotometers detect this divergence as non-parallel reflectance curves across the 400 nm to 700 nm visible spectrum.
Downstream thermal processing at temperatures above 175 degrees Celsius shifts disperse dye distribution within synthetic fibers, altering visible light absorption profiles across split production lots.
Metameric divergence arises when split lots utilize alternative dye combinations to hit the identical daylight shade target. If Mill 1 formulates a brown shade using Yellow C.I. 145, Red C.I. 198, and Blue C.I. 284, while Mill 2 uses alternative dye indices due to dyehouse inventory availability, the reflectance curves will cross at multiple wavelengths. While both batches match under D65 illuminant, they diverge under store lighting or incandescent lamps.
Spectrophotometric shade management mandates tracking full spectral reflectance curves rather than relying exclusively on summary Delta E numbers, preventing metameric splits before fabric cutting begins.
Minor stenter speed variations and weekend thermal fluctuations are sometimes treated as negligible, but thermo-migratory dyes remain fundamentally sensitive to heat gradients.

Partition

5-5-5 Shade Sorting and Roll Allocation Strategies
Shade variance across split dyeing production batches cannot be completely eliminated, requiring controlled roll allocation strategies before fabric enters the cutting room. 5-5-5 shade sorting represents a 3D coordinate partitioning method that groups fabric rolls into visually uniform clusters based on spectrophotometric measurements. The system divides L , a , and b color space into a grid of uniform 3D blocks centered on the master approval standard.
A single block designation, such as 5-5-5, represents rolls falling precisely within the central target grid cell.
Rolls assigned coordinates like 4-5-5 exhibit slightly lower lightness (darker), while 6-5-5 rolls indicate higher lightness (lighter). Coordinates 5-4-5 and 5-6-5 denote red-green axis shifts, while 5-5-4 and 5-5-6 cover yellow-blue axis deviations. By partitioning split production batches into discrete 5-5-5 sorting blocks, apparel manufacturers ensure that all cut panels for a specific garment assembly bundle originate from the identical shade block.
Inter-mixing panels from block 4-5-5 and block 6-5-5 within a single stitched garment produces visible shade banding across body panels, leading to retail floor rejections.
- Spectrophotometric Roll Mapping requires taking spectral readings from the head, middle, and tail of every finished fabric roll in the production lot.
- Data Input and Indexing mandates uploading L a b coordinates directly into automated shade sorting software to compute 5-5-5 grid assignments.
- Taper Matrix Grouping enforces sorting rolls into chronological spreading sequences based on internal roll-to-roll chromaticity drift directions.
- Cutting Room Bundle Isolation dictates locking spreading tables to single 5-5-5 shade groups and enforcing strict panel bundling separation.
Roll allocation strategies must account for head-to-tail shade tapering within individual rolls. Spreading machines laying down multiple fabric plies for automated cutting stack layers directly on top of one another. If a fabric roll exhibits continuous shade drift from its outer head to its inner core tail due to cooling gradients during batch winding, cutting vertical garment panels across the lay creates panel-to-panel shade steps.
Technologists prevent taper defects by measuring head-and-tail spectrophotometric data, flagging rolls with head-to-tail Delta E CMC values exceeding 0.50 for single-ply spreading or dedicated end-use application.
When split production orders yield broad 5-5-5 block distributions, cutting rooms must divide orders into isolated production sub-batches, increasing setup changes, marker adjustments, and fabric remnant scrap ratios.
Under standard commercial supply agreements, fabric rolls assigned to adjacent 5-5-5 sorting blocks may be combined within the same lay only if the calculated boundary distance between the outer block edges remains under 0.80 Delta E CMC.
Recourse

Contractual Tolerance Protocols and Claim Mechanisms
Commercial contracts governing split dyeing production orders must ground shade acceptance parameters in clear numerical spectrophotometric standards rather than subjective visual approvals. A robust purchase order specification names the master color standard by digital spectral reflectance data (XML or QTX file format) rather than physical swatch cards, which degrade and fade over time. The contract defines the color difference equation (CIEDE2000 or CMC 2:1), primary and secondary standard illuminants (D65 10-degree, F02 10-degree), aperture size (LAV 25 mm), specular mode (SCI), and maximum allowable Delta E limits for individual roll acceptance and batch-to-batch variance.
Legal recourse mechanisms depend on pre-established incoming quality control protocols. When incoming bulk rolls arrive at the garment factory or central warehouse, the buyer must execute systematic acceptance sampling under ISO 2859-1 standards. Spectrophotometric data captured from sample rolls must be compared directly against the baseline digital target.
If the average lot Delta E CMC exceeds contractual limits, or if more than 5 percent of inspected rolls fall outside designated 5-5-5 shade sorting block ranges, the buyer issues an immediate formal notice of non-conformance, quarantining the lot before cutting operations commence.
Standard commercial clauses stipulate that once fabric is cut into garment components, the buyer forfeits the right to reject the cloth for shade non-conformity, transferring liability to the garment factory unless latent chemical defects or severe un-noted metamerism are proven. Purchase contracts avoid this trap by incorporating specific pre-cutting inspection windows, granting buyers 14 to 21 business days to complete spectrophotometric audit protocols and execute 5-5-5 grid mapping. Contracts must detail financial penalty structures, specifying whether non-conforming split batches trigger complete fabric replacement, mill-funded shade re-sorting costs, or liquidated damages calculated per meter of rejected cloth.
Even when freight delays compound shade errors, establishing precise spectrophotometric parameters within procurement dossiers protects both mill and buyer, transforming potential commercial disputes into clear mathematical determinations governed by verified physical standards.