Establishing Statistical Core Sampling Protocols for Insect Honeydew and Synthetic Polymer Contamination Acceptance Limits
Core sampling cotton bales with 22mm probes across 10% lot fractions enables precise thermodetector and HPLC acceptance limits for honeydew and synthetics.

Sugar

Biochemical Origin and Exudate Characterization
Late-season insect secretions on raw lint accumulate rapidly and disrupt spinning machinery during standard operation. The primary sources are the cotton aphid (Aphis gossypii) and the sweetpotato whitefly (Bemisia tabaci). Both feed by piercing phloem tissue for plant sap, retaining proteins and voiding excess carbohydrates directly onto open bolls.
Unlike normal physiological sugars ~ mostly fructose, glucose, and sucrose, which distribute evenly across the fibre surface during typical crop development ~ these deposits behave erratically. Exudates from feeding insects introduce complex trisaccharides and rare disaccharides, particularly melezitose and trehalulose, which never appear in healthy, uninfested plant tissue.
Chemical testing separates the two species based on sugar structure. Whitefly deposits contain heavy concentrations of trehalulose ~ frequently thirty to forty percent of total carbohydrates ~ alongside fructose and glucose. Aphid secretions skew toward melezitose, often exceeding forty percent of the total sugar mass.
Trehalulose is an alpha-1,1-linked sucrose isomer, making it exceptionally hygroscopic. That structural trait drops the humidity threshold where lint turns tacky. While normal plant sugars deliquesce only under high ambient humidity, trehalulose absorbs water and turns sticky at relative humidities as low as forty-five percent at twenty-two degrees Celsius.
Honeydew droplet concentration creates localized apron jams while plant sugars disperse evenly across drafting zones.
How these sugars distribute across raw bales dictates downstream processing performance. Plant sugars disperse in a low, uniform background concentration that rarely interrupts machinery as long as total reducing sugars stay under zero point five percent by mass. Insect honeydew, by contrast, lands on lint in discrete droplets that form concentrated sticky spots.
Ginning and opening do not blend these droplets away; they simply smear them across adjacent fibres. The high concentration persists through bale compression, leaving hidden pockets of tackiness embedded deep in the bale.

Thermal and Rheological Behavior under Mill Conditions
Opening and carding machinery generates localized friction and heat. Contact temperatures routinely top thirty-five degrees Celsius as cotton passes through high-speed card wire and drafting aprons. Under those temperatures, honeydew sugars cross their glass transition threshold, turning from solid crystalline droplets into tacky, viscoelastic fluids.
That phase change causes the sugars to adhere to metallic and synthetic surfaces ~ particularly steel card wires, rubber drafting aprons, and aluminum guide plates.
The severity of adhesion depends on the specific sugars present in the core sample. Melezitose has a higher melting point and a tighter crystalline structure, resisting melt at lower drafting speeds. Trehalulose, however, remains semi-liquid even under standard conditioning of sixty-five percent relative humidity and twenty-one degrees Celsius.
When trehalulose-laden lint reaches the draw frame drafting zone, shear force from the rolls squeezes the viscous droplet directly onto the rubber apron. Passing fibres adhere to that film, forming lap-ups that wrap drafting rolls, sever slivers, and shut down lines.
Synthetic polymer contamination behaves differently under mechanical stress. Polypropylene twine scraps, polyethylene wrap pieces, and polyester strapping fragments enter the lint stream during hand harvesting, field transit, or bale opening at the gin. Unlike plant or insect sugars, polyolefins do not dissolve or smear at room temperature; they remain as distinct film strips, fibrillated tapes, or monofilaments scattered through the bale.
Static electricity drives the primary operational difficulty here. Polypropylene develops a strong negative triboelectric charge when rubbed against cotton, causing plastic shreds to cling stubbornly to lint clusters throughout the blowroom.

Synthetic Inclusion Types and Mechanical Interaction
Low-density polyethylene bale covers create distinct mechanical problems during yarn formation. When polyethylene pieces hit the carding machine, the high-speed licker-in cylinder shreds the soft film into hundreds of microscopic, thin-walled flakes. Because these flakes carry negligible mass relative to their surface area, they bypass air-waste separators and float forward with the web.
In combed yarn production, larger polyolefin fragments snag on comb needles, bending pins, dropping the web, and inducing periodic count variations in the sliver.
Polypropylene twine fragments cause severe defects that often remain undetected until the fabric is dyed. Fibrillated polypropylene tape resists the reactive, direct, and acid dyes used on cellulosic fibres. In rotor spinning, small fragments lodge in the rotor groove, disrupting false-twist insertion and creating frequent thick places.
In ring spinning, the film is either drafted directly into the yarn core or protrudes as surface hairiness. In either case, the hydrophobic polymer repels water-based dye liquors during finishing, leaving uncolored white specks across finished woven or knitted goods.
When honeydew and synthetic debris occur within the same lot, quality control becomes considerably harder. Sticky droplets act as an adhesive, binding fine polymer dust, soil, and leaf trash against the fibre wall. This composite mass prevents lint cleaners and carding beaters from dislodging solid polymer fragments.
The tacky film binds synthetic inclusions inside the fibre mass, carrying both physical and chemical contaminants into the mill. What structural factors determine whether a sticky droplet remains localized or migrates through adjacent layers under multi-ton bale compression?


Blade
Core Probe Geometry and Mechanics
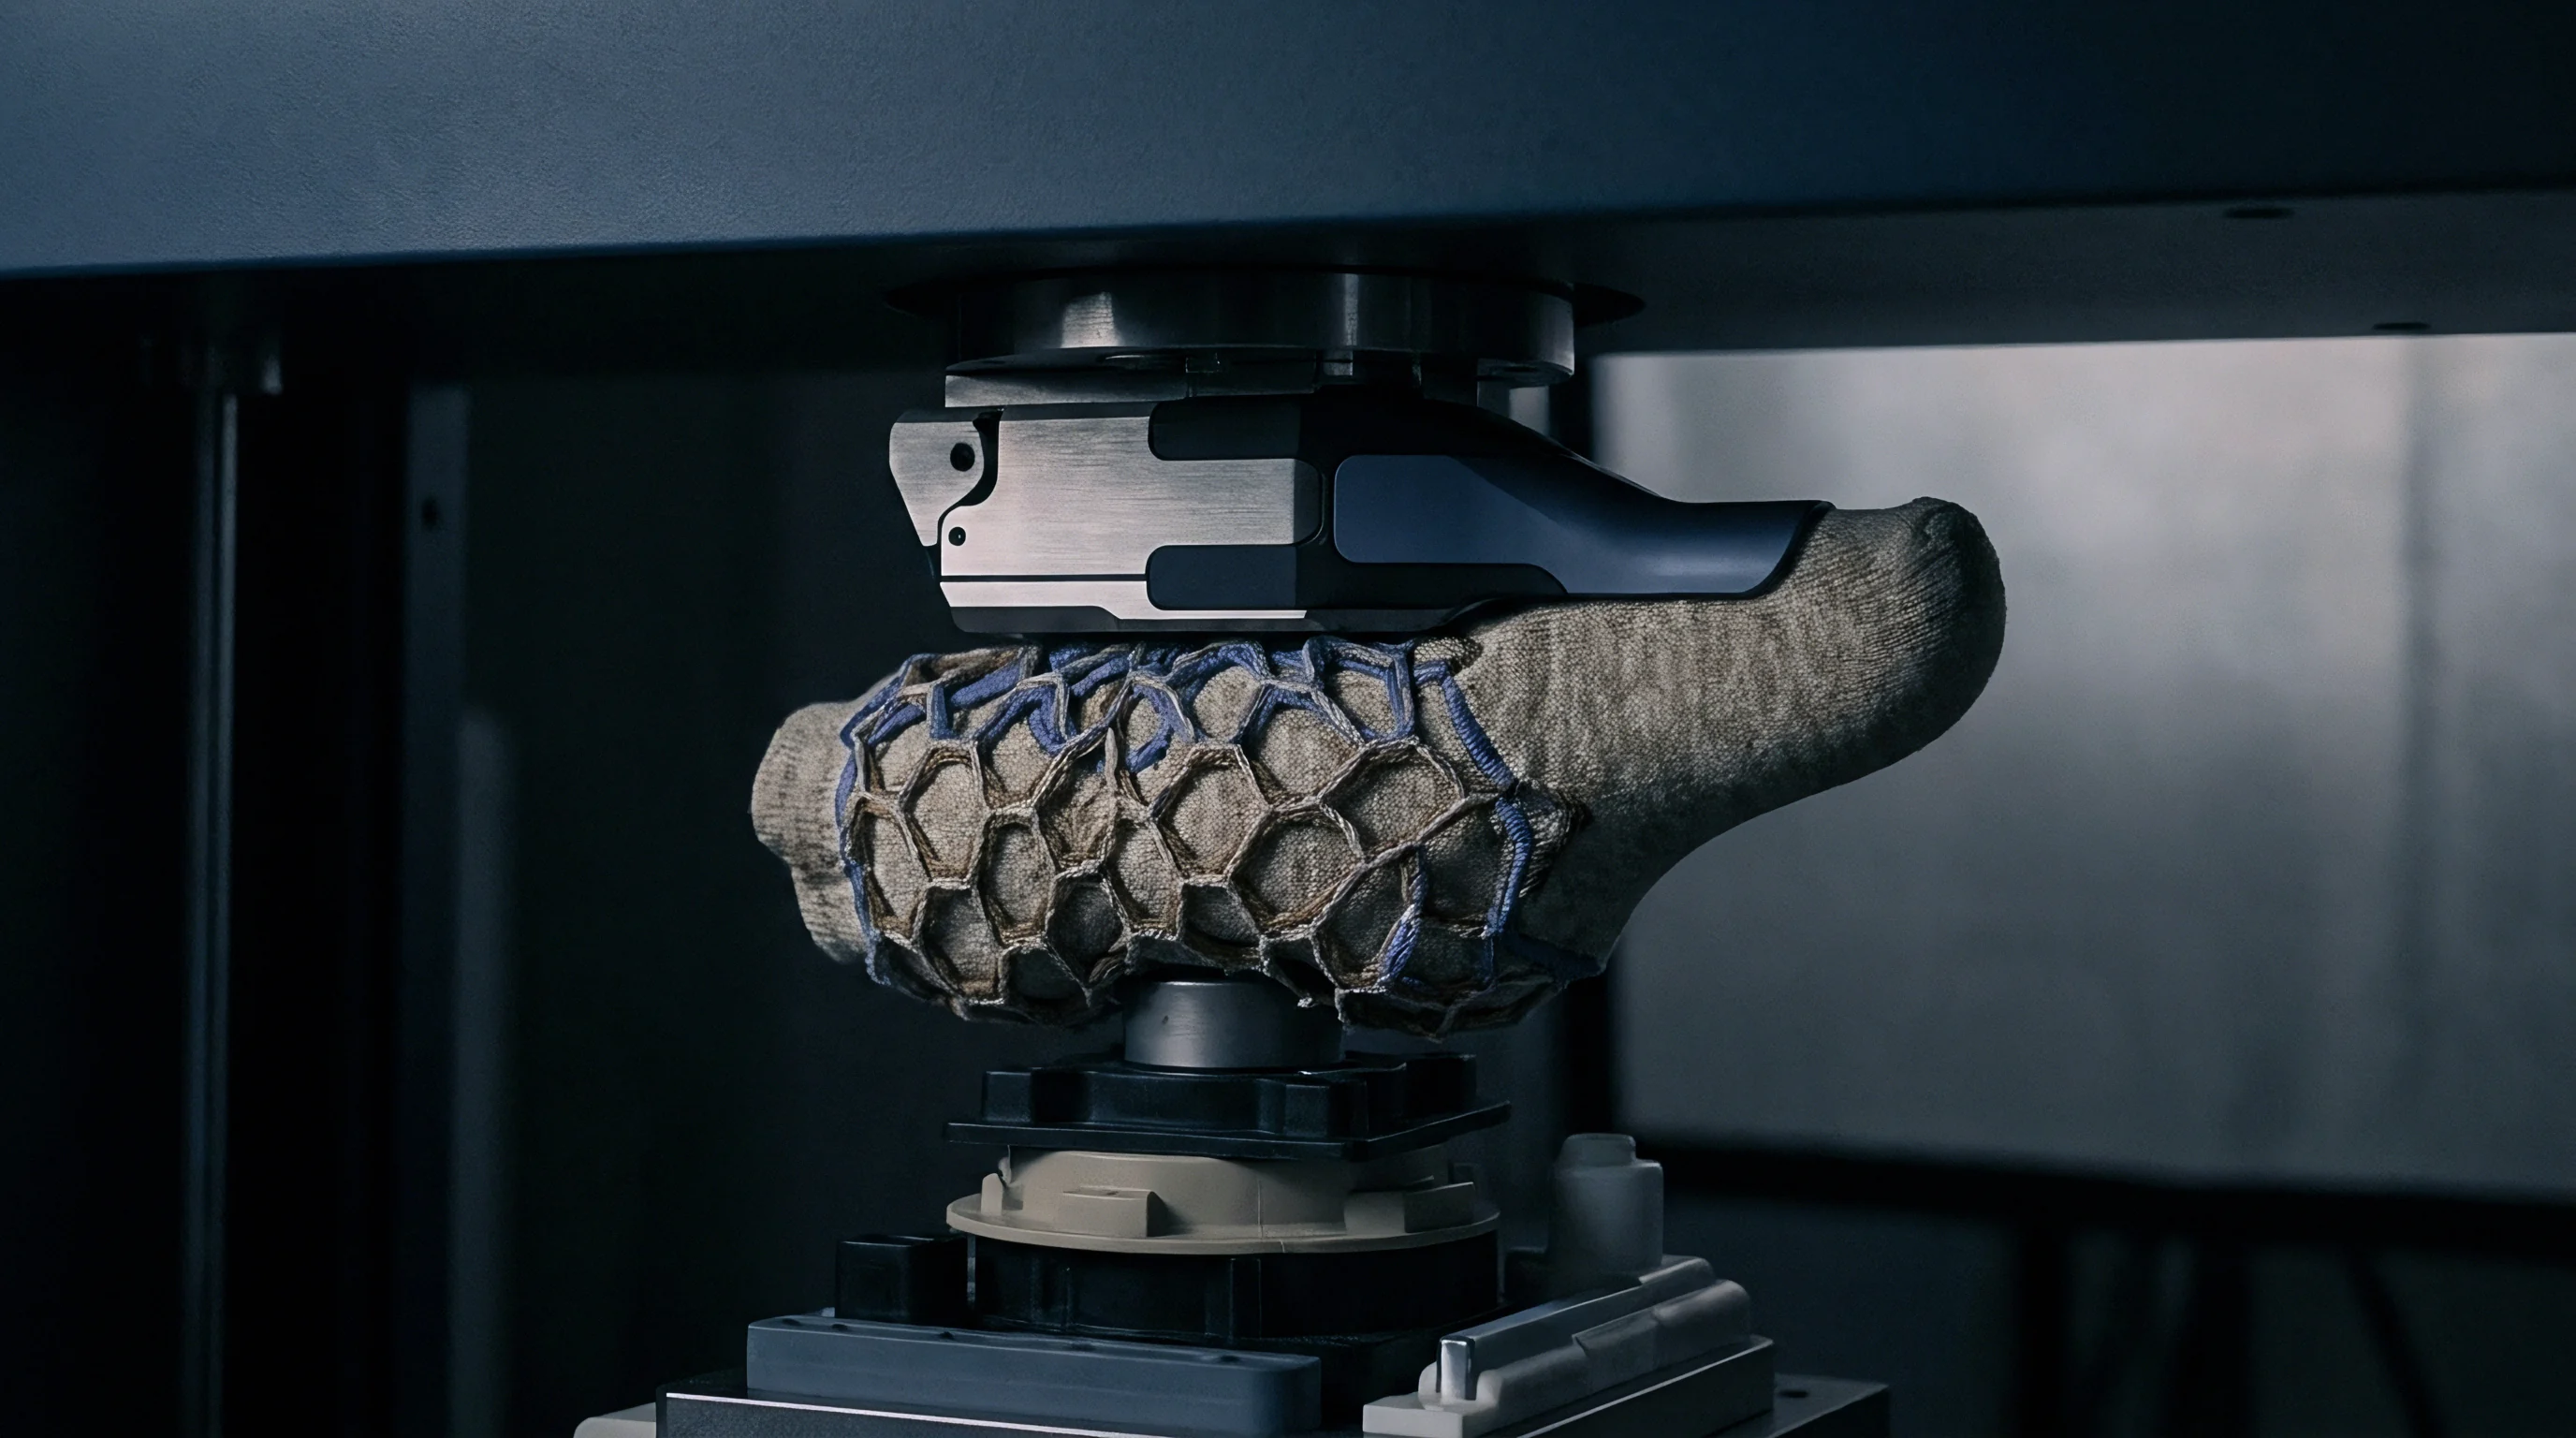
Extracting representative samples from compressed cotton bales depends largely on probe design. Sampling tools utilize a hollow stainless steel barrel fitted with a hardened tool-steel cutting tip on the leading edge. The tip’s inner diameter fixes both the sample mass and core structure.
Standard probes run from eighteen millimeters to thirty-two millimeters across. Below eighteen millimeters, the tip shears cotton fibres excessively, skewing length distribution data and compressing sugar deposits into an unreadable smear. Above thirty-two millimeters, insertion resistance climbs sharply, distorting bales and stalling drive motors on automated sampling rigs.
Tip geometry governs how the tool penetrates the bale without disturbing where internal contaminants sit. Dual-beveled tips with internal relief angles prevent core plugging. As the probe advances, cotton passes into an inner shaft where a wider bore lowers friction against the incoming core.
Edge sharpness is critical. A dull edge pushes synthetic films and high-density polymer straps ahead of the barrel instead of cutting through them, causing systemic under-counting of synthetic inclusions in the sample volume.
- Position the bale securely on the automated sampling platform to prevent lateral displacement under hydraulic pressure.
- Align the core probe perpendicular to the long side of the bale, targeting specified coordinate points across the bale face.
- Drive the rotating probe at seven hundred revolutions per minute while advancing at a linear velocity of forty millimeters per second.
- Penetrate to a depth of four hundred millimeters, reaching past the dense outer shell into the inner core.
- Retract the probe smoothly while maintaining internal vacuum to draw the intact sample into the sealed collector chamber.
- Eject the continuous core tube into a moisture-sealed polyethylene container, recording bale identification and depth coordinates.
Probe pressures run at three hundred kilopascals during raw bale sampling. The rotational speed of the tip must balance clean cutting against thermal damage to contaminants. Excessive rotational speed generates friction heat at the cutting edge.
Over sixty degrees Celsius, low-density polyethylene film melts directly onto the tip ~ contaminating subsequent draws and scorching honeydew into altered chemical forms that distort chromatographic testing.

Spatial Distribution and Stratification in Universal Bales
Universal high-density bales ~ compressed to between three hundred sixty and four hundred fifty kilograms per cubic meter ~ do not contain evenly distributed contaminants. The bale press stacks lint in discrete layers, or “booklets,” as the hydraulic tramper charges the box. Honeydew location reflects harvest conditions in the field.
If a picker crosses an isolated patch of whitefly-infested plants, that contaminated lint packs into specific booklets in the press. Consequently, honeydew concentrates in distinct planar bands running perpendicular to the direction of compression.
Synthetic polymer contamination skews heavily toward the outer surfaces. Polypropylene wrapping, strap scraps, and outer bag fragments sit mainly within the first fifty millimeters of the bale volume. By contrast, hand-harvested trash and internal packaging scraps scatter randomly through individual booklets.
Surface scraping overcounts packaging debris while completely missing deep honeydew bands. Driving a core probe horizontally ~ perpendicular to the compressed booklets ~ guarantees the tool cuts across every layer within its penetration depth.
Probing horizontally through the side faces provides an accurate cross-sectional view of booklet variability. Driving the probe parallel to the layers risks capturing only a clean booklet or an exclusively contaminated stratum, skewing test results. Sound statistical protocols employ double-sided sampling ~ driving probes in from opposite long faces toward the geometric center to capture both surface inclusions and internal honeydew layers.

Sample Mass Accumulation and Handling Protocols
Statistically valid testing requires collecting sufficient total sample mass to detect sparse, isolated contaminants. A single draw with a twenty-five millimeter probe to a depth of four hundred millimeters yields about eight to twelve grams of lint, depending on bale density and moisture regain. In a standard commercial lot of one hundred bales, taking one core per bale accumulates roughly one kilogram of raw sample.
That single kilogram has to represent the entire twenty-two metric ton lot without bias or degradation.
Handling protocols between extraction and laboratory testing dictate the reliability of chemical sugar assays. If raw cores sit in humid air, they absorb moisture rapidly, initiating bacterial and fungal breakdown of honeydew. Microbes consume simple sugars, fructose, and glucose within forty-eight hours at twenty-five degrees Celsius, artificially depressing total reducing sugar figures.
Samples slated for sugar testing must be sealed immediately in vapor-proof barrier bags with active desiccant or maintained below four degrees Celsius until extraction.
Testing for synthetic polymers requires absolute isolation from extraneous packaging materials. Collection containers must be non-polyolefin ~ antistatic aluminum foil or dedicated paper bags work best. Plastic tape, polyolefin twine, or document pouches anywhere near the sampling floor introduce airborne film shreds and static-charged dust into open collector tubes, creating false positives during optical screening.
Core probes must cut cleanly through undisturbed lint without dragging outer bale wrapping into the sample chamber.


Ratio

Statistical Foundations and Distribution Models
Designing sampling plans for unevenly distributed contaminants requires selecting the right probability distributions. Continuous chemical variables with minimal spatial variance fit standard Gaussian models. Honeydew and synthetic polymers do not.
Honeydew spot counts show heavily right-skewed, over-dispersed distributions that fit a negative binomial model. Synthetic polymer inclusions occur as rare, isolated physical events across the fibre mass, matching zero-inflated Poisson probability models.
Acceptance probability calculations confirm this distribution model. The probability P(X = k) of finding k synthetic polymer fragments in a core sample drawn from a lot with mean contamination rate λ follows the Poisson formula:
P(X = k) = fracλk e-λk!
When defect rates are low, the probability of finding zero defects in a small sample stays high ~ even in heavily contaminated lots. That mathematical reality creates real financial risk for both buyer and seller during acceptance testing. Expanding sample size narrows the operating characteristic curve, sharpening the line between conforming and non-conforming lots.
Calculating the required sample cores n for a lot size N means balancing statistical confidence against lab testing costs. Simple random sampling without replacement relies on the hypergeometric distribution, though for large lots where N exceeds one hundred bales, binomial approximations give plenty of precision. The necessary core count hinges on the target Acceptable Quality Level, Lot Tolerance Percent Defective, consumer risk allowance β, and producer risk allowance α.
Standard criteria usually set α = 0.05 and β = 0.10.
Operating Characteristic Curves and Risk Allocation
An Operating Characteristic curve maps how a sampling plan performs under field conditions. The horizontal axis shows the actual defect proportion p across the lot, while the vertical axis tracks the probability Pa that the plan accepts the lot. An ideal OC curve drops vertically right at the quality threshold ~ accepting every good lot and rejecting every bad one.
In practice, finite sample sizes produce rounded curves.
| Sampling Scheme | Cores Per Lot (n) | Acceptance Number (c) | AQL (p for Pa=0.95) | LTPD (p for Pa=0.10) | Consumer Risk Beta at 5% Defect Rate |
|---|---|---|---|---|---|
| Square Root Plan | 15 | 0 | 0.34% | 14.23% | 0.463 |
| Ten Percent Standard | 20 | 0 | 0.26% | 10.87% | 0.358 |
| ISO 2859-1 Level I | 32 | 1 | 1.11% | 11.35% | 0.521 |
| ISO 2859-1 Level II | 50 | 1 | 0.71% | 7.41% | 0.279 |
| Tightened Dual-Core | 80 | 2 | 1.02% | 6.42% | 0.231 |
The table highlights the key flaw in traditional square-root sampling schemes (sqrtN + 1). In a two-hundred-bale lot, a fifteen-core sample with an acceptance number of c = 0 leaves a Lot Tolerance Percent Defective of fourteen point twenty-three percent. That means a shipment where over fourteen percent of bales are heavily contaminated still has a ten percent chance of slipping through inspection.
Taking on that level of consumer risk leaves spinning mills wide open to severe downtime and financial loss.
Tightening the plan to eighty cores across a two-hundred-bale lot pulls the LTPD down to six point forty-two percent while keeping producer risk low at the Acceptable Quality Level. Dual-core extraction ~ sampling each selected bale from opposite sides ~ doubles spatial coverage across booklets without doubling the labor cost of moving bales around the floor. It balances sampling logistics against analytical precision.

Worked Statistical Acceptance Calculation
Consider a mill taking delivery of N = 100 universal density bales contracted to contain zero heavy honeydew. The agreement sets an AQL of two percent (p1 = 0.02) and an LTPD of ten percent (p2 = 0.10). The mill draws n = 20 core samples at random from twenty separate bales, setting the acceptance threshold at c = 0 sticky bales on thermodetector tests.
A core sampling intensity of ten percent in a two-hundred-bale lot yields an eighty-five percent probability of detecting synthetic inclusions at two percent defect prevalence.
The probability of finding zero defective bales in a sample of twenty when the lot actually holds ten percent defects (p = 0.10) comes from the binomial formula:
Pa = P(X = 0) = binom200 (0.10)0 (1 – 0.10)20-0
Pa = 1 × 1 × (0.90)20 ≈ 0.1216
The acceptance probability comes out to twelve point sixteen percent. That puts consumer risk β slightly above the target ten percent ceiling, proving that twenty cores aren’t enough to protect the mill from a ten percent defect rate. Lowering β below zero point ten with c = 0 requires solving:
(1 – p2)n le β implies (0.90)n le 0.10
n ln(0.90) le ln(0.10) implies n (-0.10536) le -2.30258 implies n ge 21.85
The minimum sample size is twenty-two bales. Pulling twenty-two cores from twenty-two individual bales delivers the statistical power needed to enforce the contract limit within target risk bounds. A reduced six-core protocol that allowed twelve contaminated bales to pass undetected into a high-speed rotor line once generated a forty-two thousand dollar loss on a single yarn order.
Sampling assumptions must hold up mathematically as lot sizes change:
- Spatial Autocorrelation assumes adjacent bales in a ginning lot share correlated contamination levels because harvest paths are continuous.
- Homogeneous Blending assumes cores are mechanically blended and carded in the lab before sub-sampling for chemical assay.
- Detection Efficiency assumes instruments achieve a one hundred percent capture rate for sticky droplets larger than target diameter thresholds.
- Zero Core Contamination assumes probe edges cut cleanly without dragging synthetic wrapping from the bale exterior into inner cores.


Screen

Analytical Methods for Honeydew Quantification
Quantifying insect honeydew requires testing methods that separate sticky entomological sugars from benign plant sugars. The Sticky Cotton Thermodetector (SCT) remains the international benchmark under International Textile Manufacturers Federation guidelines. In SCT testing, a zero point five gram core web is pressed between an aluminum plate heated to eighty-four degrees Celsius and a cold top plate for twelve seconds under a fixed load.
As the heated sample cools against a thin plastic sheet, sticky sugar spots melt and adhere, forming visible impressions when dusted with specialized dry powder. An operator or automated scanner then counts the spots.
The High-Speed Stickiness Detector (H2KM) automates this process for high-throughput testing houses. The H2KM web-prepares, heat-presses, and scans the sample using an optical array that records spot counts, surface areas, and spatial patterns automatically, removing operator bias. High-Performance Liquid Chromatography (HPLC) provides precise chemical quantification: it extracts soluble sugars in hot deionized water and routes the supernatant through an anion-exchange column paired with pulsed amperometric detection.
HPLC isolates individual mass fractions, giving exact microgram-per-gram concentrations for trehalulose, melezitose, sucrose, glucose, and fructose.
| Testing Method | Primary Contaminant Target | Sample Size | Test Duration | Repeatability CV% | Detection Limit |
|---|---|---|---|---|---|
| SCT Thermodetector | Honeydew Sticky Spots | 0.5 grams | 3.0 minutes | 18.5% | 1 sticky spot / web |
| H2KM High-Speed | Honeydew Spot Mass & Area | 3.0 grams | 0.5 minutes | 12.2% | 1 sticky spot / web |
| HPLC Amperometric | Trehalulose & Melezitose | 1.0 gram | 25.0 minutes | 3.1% | 10 ug / gram lint |
| Gravimetric Melt Extraction | Polypropylene / Polyethylene Mass | 50.0 grams | 120.0 minutes | 5.4% | 1 ppm by weight |
| NIR Automated Web Scan | Synthetic Film / Twine Scrap | 10.0 grams | 0.2 minutes | 8.7% | 0.1 mm sq area |
Choosing an analytical method comes down to required throughput and legal standing. HPLC offers exact chemical figures, but its long run time and high cost keep it reserved mostly for arbitration re-tests. SCT and H2KM measure physical tackiness directly under simulated mill conditions, making them the primary choices for routine acceptance testing.

Synthetic Polymer Detection and Mass Fraction Determination
Finding synthetic polymer inclusions requires methods that spot hydrophobic film scraps, monofilaments, and hard plastic specks inside cotton lint. Optical sorting arrays on lab opening gear scan carded webs with high-speed color cameras as the web passes across an illuminated glass plate. Contrast, transparency, and gloss reveal foreign matter, though white polypropylene film that matches the cotton fibre can slip past visible-spectrum cameras, demanding specialized lighting setups.
Testing cotton under International Textile Manufacturers Federation standards using thermodetector methods converts thermal spot counts into enforceable commercial grade classifications.
Near-Infrared spectral imaging picks up translucent and white polyolefins reliably. Polypropylene and polyethylene show strong carbon-hydrogen absorption bands between fourteen hundred and seventeen hundred nanometers, whereas cellulosic fibres display distinct hydroxyl peaks. High-speed NIR cameras scan the opened core sample, flagging polymer fragments as small as zero point one square millimeter regardless of fibre color.
Gravimetric solvent extraction provides an exact measurement of synthetic polymer mass fractions. A representative fifty-gram core sample is submerged in boiling xylene or hot toluene for two hours. The solvent dissolves polypropylene, polyethylene, and polystyrene without attacking the cotton.
Filtering the solution, evaporating the solvent under vacuum, and weighing the dried polymer residue gives the contamination level directly in parts per million (ppm) by mass.
Laboratory screening protocols can fail when applied to complex commercial core samples:
- Thermal Spot Overlap occurs when heavy honeydew causes adjacent droplets to merge into one large spot on thermodetector sheets, artificially lowering spot counts.
- Static Dispersion Failure happens when low relative humidity during web screening causes plastic shreds to cling to machine walls rather than pass the camera.
- Solvent Extraction Bias occurs when synthetic finishes or spin lubricants on blended fibres dissolve with target polyolefins, inflating mass readings.
- Spectral Masking arises when heavy soil, leaf dust, or seed coat trash physically covers underlying polyethylene film, blocking NIR excitation light.
Elevated thermodetector spot counts can stem from environmental dust accumulation during transit rather than actual insect honeydew exudates.


Threshold
Classification Boundaries for Honeydew Stickiness
Setting realistic acceptance limits means turning lab test numbers into operational risk thresholds for the mill. Standard stickiness grades stem directly from raw SCT counts. Core samples showing zero to four sticky spots are rated non-sticky and pose minimal threat to carding or spinning.
Counts from five to twelve spots signal light stickiness ~ manageable by lowering room humidity and adding anti-sticking processing aids in the blowroom.
Moderate stickiness ranges from thirteen to twenty-four spots per test. At this level, mills see frequent roller lapping at draw frames, higher end-break rates in ring spinning, and fast sugar build-up in rotor grooves. Anything over twenty-four spots on the SCT scale is classified as heavily sticky.
Feeding heavily sticky cotton into the line causes endless machine jams, ruined yarn quality, and damaged wire clothing ~ eventually forcing a full line shutdown.
HPLC sugar limits offer clear mass-fraction boundaries. Total reducing sugars under zero point three zero percent by dry lint mass indicate safe running conditions. Trehalulose over zero point ten percent or melezitose over zero point fifteen percent triggers immediate warning flags.
Because trehalulose is so aggressively hygroscopic, a high trehalulose reading overrides an acceptable total sugar percentage, forcing immediate lot isolation or chemical treatment.

Acceptance Limits for Synthetic Polymer Inclusion

What Defines an Unacceptable Synthetic Polymer Contamination Level?
Acceptable polymer limits depend on yarn count, spinning system, and end use. For premium combed compact yarns used in high-density luxury sheeting or bright white shirting, tolerance is effectively zero ~ defined commercially as less than zero point one ppm by mass. A single polypropylene fragment in fine combed yarn creates a visible defect that can reject an entire batch of dyed garments.
For standard carded ring-spun yarns (Ne 20 to Ne 40), contracts typically cap synthetic polymers at five ppm. Open-end rotor lines spinning coarse utility yarns (Ne 6 to Ne 16) can handle slightly more, setting the ceiling at twenty-five ppm. Pushing past twenty-five ppm builds up rotor deposits so quickly that operators have to stop and clean rotors every two hours instead of during standard twenty-four-hour maintenance shifts.
Carding roller stop rates correspond directly to stickiness ratings. Mill managers receiving non-conforming core test reports follow a clear protocol to keep production moving:
- Immediate Lot Isolation seals non-conforming bales in dedicated warehouse storage, preventing transfer to the blowroom laydown.
- Secondary Split-Core Re-Testing triggers analytical verification on retained core samples via HPLC and gravimetric solvent extraction.
- Laydown Percentage Capping caps non-conforming cotton at five to ten percent of the total blend mixed into clean lint.
- Environmental Conditioning Adjustments drops relative humidity in carding and drafting areas to forty-five percent to keep sugar tackiness in check.
- Commercial Claim Notice files formal dispute paperwork with the supplier within the mandatory ten-day notification window.
The International Cotton Association Contract Rules State That Any Delivery Exceeding Contracted Stickiness Limits By Two Grade Tiers Entiteles The Buyer To Absolute Lot Rejection At Seller Expense. That clause changes risk allocation fundamentally. Suppliers must guarantee core-tested limits across the entire shipment volume or cover return freight, testing fees, and replacement costs.


Contract

Commercial Mechanisms and Landed Cost Adjustments
Writing core sampling metrics directly into supply contracts gives spinning mills real financial protection. Purchase specs should detail probe diameter, sampling frequency, test methods, and exact numerical thresholds. Standard phrasing like “fair average quality” or “merchantable cotton” leaves buyers completely unprotected when sticky or plastic-laced bales hit the blowroom.
Contracts must cite explicit standards, referencing ITMF thermodetector grades or HPLC mass limits directly.
Price adjustment formulas penalize off-spec lots in proportion to what they cost to process. Standard terms apply a tiered discount per clean kilogram based on SCT counts. Lightly sticky bales take a three to five cent per kilogram penalty rebate to offset anti-static sprays and slower card speeds.
Moderately sticky lots draw discounts of eight to fifteen cents per kilogram, offsetting labor and downtime losses on the spinning floor.
| Contamination Grade | Analytical Criteria | Base Price ($/kg) | Contract Price Deduction ($/kg) | Processing Cost Surcharge ($/kg) | Net Landed Cost Impact ($/kg) |
|---|---|---|---|---|---|
| Grade 1: Conforming Clean | SCT < 5 spots, Synthetics < 1 ppm | $2.10 | $0.00 | $0.00 | $2.10 |
| Grade 2: Light Honeydew | SCT 5-12 spots, Synthetics < 5 ppm | $2.10 | -$0.05 | +$0.03 | $2.08 |
| Grade 3: Moderate Honeydew | SCT 13-24 spots, Synthetics < 10 ppm | $2.10 | -$0.15 | +$0.12 | $2.07 |
| Grade 4: Heavy Honeydew | SCT > 24 spots, Synthetics < 25 ppm | $2.10 | -$0.35 | +$0.28 | $2.03 |
| Grade 5: Critical Polymer | Synthetics > 25 ppm (Any SCT) | $2.10 | Full Rejection | +$0.45 (Return Freight) | $2.55 (Loss Base) |
Working out true net landed cost requires pairing contract discounts with internal operational surcharges. As shown in the landed cost matrix, accepting a Grade 4 moderately sticky lot yields a thirty-five cent contract discount. But running that cotton adds twenty-eight cents per kilogram in floor costs from reduced card speeds, chemical additives, and higher waste.
The actual net savings shrinks to seven cents per kilogram ~ a margin that disappears the moment a roller wraps and breaks a machine.

Customs Declarations and Tariff Line Impact
Cross-border raw cotton shipments face tight customs scrutiny over composition, origin, and overall condition. Harmonized System Chapter 52 separates raw ginned lint, cotton waste, and scoured or treated cotton. Contamination levels don’t change the main six-digit tariff code (5201.00 for uncarded, uncombed cotton), but heavy synthetic polymer contamination can trigger customs disputes over classification and declared valuation.
When customs officials re-evaluate cotton lots carrying high levels of synthetic inclusions, they often question the declared transaction value. If a buyer takes a heavily contaminated lot at a steep discount, customs agents want proof that the discount reflects actual commercial damage rather than hidden value transfer. Submitting certified core sampling dossiers with SCT, NIR, and solvent extraction results provides clear evidence of quality degradation, supporting the adjusted invoice value for duty calculations.
Origin verification under trade agreements requires strict audit trails for agricultural commodities. Honeydew testing and core records offer supporting proof that bales originated from declared growing areas with known whitefly or aphid pressure during particular crop years. Thorough sampling documentation ties the physical lot directly to its origin certificate, blocking unauthorized blending of non-originating lint during transit.

Arbitration Protocols and Legal Dossier Requirements
When contract disputes head to commercial arbitration, everything turns on the legal standing of the sampling and test documentation. Buyers routinely incorporate strict sampling provisions directly into international cotton supply agreements. Under International Cotton Association rules, claims over honeydew stickiness or synthetic contamination require joint sampling or independent core extraction by an accredited inspection agency at discharge or the receiving mill warehouse.
An arbitration dossier needs an unbroken chain of custody for every sample taken. The file must include original sampling logs signed by certified personnel ~ recording probe dimensions, penetration depths, bale IDs, sampling humidity and temperature, and immediate sealing records. Test reports must come from ISO/IEC 17025 accredited labs for textile methods, showing calibrated equipment numbers, test room environment logs, and individual specimen readings along with mean and coefficient of variation figures.
Arbitrators throw out claims built on hand-picked surface samples or uncalibrated mill-floor tests. The tribunal checks whether the core sampling plan followed the exact statistical sample sizes written into the agreement. Showing strict compliance with randomized, depth-controlled core extraction backed by accredited lab chromatograms guarantees that price adjustments or lot rejections will stand up before international arbitration panels.