Fibre Price per Kilo Translated into Cost per Finished Metre
Translating fibre price per kilo into cost per finished metre requires adjusting raw cost for commercial regain, spinning yields, weaving crimp, finishing shrink, and customs tariffs.

Conversion
Bridging the gap between raw fibre quotes and finished yarn costs requires tracking physical weight loss through early processing. Spot market reports state raw fibre in gross clean mass or baled weight, yet no spinning frame converts raw staple into yarn without shedding material. Moisture, non-lint trash, short fibres, and comb waste reduce the usable yarn recovered per kilogram of raw stock.
Taking raw fibre tenders at face value without adjusting for yield distorts baseline material costs before spinning begins.
Standard commercial terms base purchase weights on official moisture regain allowances rather than actual dry mass at the dock. International standard ISO 6741 sets the commercial mass calculations used to reconcile invoice weights against lab test results. If cotton arrives at seven percent moisture against an official regain allowance of 8.5 percent, the invoiced weight exceeds the dry mass entering the bale room.
Synthetics like polyester carry almost no moisture regain allowance, skewing weight calculations in blended lots. Mill audits regularly show how ignoring regain differences across blended fibres creates systematic pricing errors in raw material costing.
Commercial weight calculations under ISO 6741 set official regain rates at 8.5 percent for cotton and 0.4 percent for polyester, moving invoice mass by up to two percent relative to oven-dry weight.

Raw Fibre Conditioning and Commercial Mass Standards
Conditioning calculations adjust raw fibre weight to standard laboratory atmospheric conditions ~ 20 degrees Celsius and 65 percent relative humidity. Under ASTM D2495, sample tufts are oven-dried at 105 degrees Celsius until mass stabilizes. Standard commercial moisture regain is then added back to the dry mass based on fibre type.
Official regain adds 8.5 percent to the dry weight of pure combed cotton. Viscose rayon carries a 13.0 percent allowance, acrylic takes 2.0 percent, and polyester sits at 0.4 percent. For a 65/35 polyester/cotton blend, the weighted official regain works out to 3.235 percent.
Discrepancies arise when incoming fibre moisture deviates from these baselines. A thousand-kilogram bale lot of raw cotton delivered at eleven percent moisture contains 900.9 kilograms of dry fibre and 99.1 kilograms of water. Adding the official 8.5 percent regain yields a commercial weight of 977.5 kilograms.
A buyer paying gross delivered weight pays for 22.5 kilograms of water that evaporates once opening begins in the blowroom. That excess moisture inflates the real clean fibre price per kilogram by 2.3 percent before carding begins.

Yield Losses across Opening and Ring Spinning
Opening and carding strip out non-lint material, motes, dust, and short unusable fibres. Trash and fly waste in these initial stages range from 3.5 percent for high-grade upland cotton to over 7.0 percent for low-grade short-staple clips. In fine yarn production, combing intentionally extracts short fibres, or noils.
Setting up a high-ratio comb extracts 12 to 18 percent of the carded web mass to increase average staple length in the remaining sliver. This extracted noil is resold into secondary non-woven applications at a steep discount, recovering little of the original raw fibre cost.
Ring spinning introduces further loss through roving scrap, edge fly, and pneumafil collection. While rotor spinning runs cleaner than ring frames, both systems shed weight when converting raw sliver into yarn packages ~ losses that must enter the cost calculation. Net fibre consumption is found by dividing the invoice fibre price by the total line yield percentage.
A ring-spun carded cotton process with an 88 percent cumulative yield transforms a 2.10 USD per kilogram raw fibre price into an effective clean material cost of 2.39 USD per kilogram of yarn.
| Processing Stage | Primary Waste Mechanism | Carded Cotton Yield % | Combed Cotton Yield % | Polyester Staple Yield % |
|---|---|---|---|---|
| Opening & Cleaning | Trash, dust, seed coat fragments | 96.5 | 96.5 | 99.2 |
| Carding & Drawing | Flat strips, fly waste, lap ends | 95.0 | 94.5 | 98.8 |
| Combing Process | Short fibre extraction (noils) | 100.0 | 84.0 | 100.0 |
| Roving & Ring Spinning | Pneumafil scrap, roving ends, fly | 96.8 | 97.2 | 98.5 |
| Winding & Clearing | Yarn defects, cut-outs, splicing | 98.5 | 98.8 | 99.1 |
| Cumulative Material Yield | Net clean yarn output percentage | 87.4 | 72.1 | 95.7 |

Transformation Costs and Direct Toll Rates
Transformation expenses cover power, labor, depreciation, ring travelers, sizing agents, and plant overhead per kilogram. Yarn count directly drives these costs: finer yarns require slower delivery speeds, higher twist multiples, and far more spindle runtime per kilogram. Spinning an Ne 40 yarn takes substantially more spindle hours per kilogram than spinning an Ne 20 yarn on the same ring frame.
As linear density drops, transformation tolls double or triple, eventually overtaking raw fibre price as the main driver of fine yarn costs.
A full yarn cost formula ties together raw fibre pricing, moisture regain adjustments, process yields, waste resale credits, and spinning conversion tolls. Total yarn cost per kilogram is calculated by taking the raw fibre purchase price divided by cumulative yield, subtracting recovered waste credits, and adding the direct toll rate for the target Ne count. Buying shorter staple to cut raw material costs often backfires.
Inferior staple drives up end breaks, forces lower spindle speeds, and pushes conversion costs higher than any initial savings on raw fibre.
- Uncorrected moisture regain billing causes systematic overpayment on wet lots that lose weight during carding.
- Unaccounted combing noil rates inflate raw material costs when ordering fine combed yarns without clear waste limits.
- Mismatching staple length to yarn count slows ring frame speeds and inflates conversion costs per kilogram.
- Ignoring waste resale recovery values distorts cost models by failing to credit income from carding fly and comb noils.
International Cotton Association rules require weight claims on raw lots to be verified through independent testing within forty-five days of arrival at the destination port. Contracts need to state clearly whether billing uses net landed weight or official commercial mass based on lab regain tests. Without explicit moisture terms in the contract, buyers have no contractual basis to claim refunds on excess shipment water weight.


Draft
Converting yarn cost per kilogram into greige fabric cost per linear metre depends on structural geometry, linear density, and loom take-up. Fabric weight per linear metre cannot be calculated by multiplying yarn price by finished grams per square metre. Warp and weft yarns crimp as they interlace, consuming more length than flat fabric dimensions indicate.
Loom settings ~ ends per centimetre, picks per centimetre, reed width, and take-up ratios ~ determine total yarn consumption for every linear metre woven.
Yarn linear density measures thread mass per unit length. Direct systems such as decitex or denier state mass per fixed length, whereas indirect systems like English Cotton Count (Ne) or Metric Count (Nm) express length per fixed mass. Precise conversion prevents structural errors when modeling yarn weights in fabric formulas.
An Ne 30 yarn converts to 19.68 tex or 196.8 decitex. Calculations must also factor in twist contraction: twisting pulls fibres together, increasing effective yarn weight per metre by two to four percent above nominal count.

Linear Density and Geometric Fabric Constants
Calculating total yarn mass per linear metre requires tracking warp and weft consumption independently. Warp consumption depends on total ends across the full reed width, including selvages, derived from finished fabric width, finished ends per centimetre, and reed expansion. Warp mass per linear metre multiplies total ends by 100 centimetres, divides by yarn length per gram, and adjusts for warp crimp percentage.
Crimp accounts for the additional yarn length used as warp threads undulate over and under weft threads.
Weft calculations follow a parallel geometric method based on pick count and reed width. Weft mass per linear metre multiplies picks per centimetre in finished fabric by 100 centimetres and insertion reed width in metres, divides by weft yarn length per gram, then adjusts for weft crimp and loom waste. On shuttleless air-jet or rapier looms, waste includes fringe selvage trims cut from each pick.
On a wide air-jet loom operating at 800 picks per minute, edge trim accounts for two to four percent of total weft consumption.
Heavier warp yarns require higher sizing pick-up and wider reed expansion to prevent contraction tears during shedding.
Warp Take-Up and Weft Crimp Mechanics
The crimp differential between warp and weft threads controls fabric thickness, cover factor, and overall yarn consumption. In plain weaves, warp threads bend around weft threads to yield 6.0 to 12.0 percent warp crimp, depending on tension and construction. Weft threads bend in turn, generating 3.0 to 8.0 percent weft crimp.
Twills and satins feature longer thread floats, keeping crimp values below those of plain weaves with matching thread density and reducing the yarn weight required per linear metre.
Sizing adds temporary mass to warp yarns to withstand high-speed shedding abrasion without breaking. Size pick-up adds 6.0 to 14.0 percent dry mass using starches, polyvinyl alcohol, or synthetic polymers. While this extra weight elevates greige fabric mass on the loom roll, desizing removes it during wet processing.
Costing models must deduct sizing mass when converting yarn prices into net fabric weight to avoid pricing sizing chemicals as textile fibre.
| Fabric Construction | Nominal Yarn Count (Warp / Weft) | Finished Density (Ends x Picks / cm) | Warp Crimp % | Weft Crimp % | Greige Mass g/m (150cm width) |
|---|---|---|---|---|---|
| Plain Weave Sheeting | Ne 30/1 / Ne 30/1 | 28 x 24 | 8.5 | 5.2 | 182.4 |
| 3/1 Warp-Face Twill | Ne 20/1 / Ne 16/1 | 42 x 22 | 10.2 | 4.1 | 278.6 |
| 5-Harness Satin | Ne 40/1 / Ne 40/1 | 54 x 32 | 6.1 | 3.8 | 165.2 |
| 2/2 Basket Weave | Ne 24/2 / Ne 24/2 | 22 x 20 | 7.8 | 6.5 | 215.1 |
Calculating Base Fabric Mass per Linear Metre
Total greige yarn cost per linear metre is determined by multiplying total warp mass and total weft mass by their respective yarn prices per kilogram. Consider a plain weave poplin with a 150-centimetre finished width, woven from Ne 40/1 combed cotton warp and weft at 4.20 USD per kilogram. Specifications call for 52 ends per centimetre and 28 picks per centimetre in finished cloth.
Reed width is set to 162 centimetres for loom contraction. Warp crimp is 8.0 percent, weft crimp is 4.5 percent, and edge trim loss on the weft adds 2.5 percent.
Total warp ends equal 150 centimetres multiplied by 52 ends per centimetre, giving 7,800 ends. Adding 120 catch-cord selvage ends brings the count to 7,920 ends. Converting Ne 40/1 yields 67.72 metres per gram.
At 8.0 percent crimp, each end requires 1.08 metres of warp yarn per linear metre of fabric, bringing total warp length to 8,553.6 metres. Divided by 67.72 metres per gram, warp mass reaches 126.3 grams per linear metre.
For the weft, 28 picks per centimetre across 100 centimetres yields 2,800 picks per linear metre. Each pick spans a 1.62-metre reed width. Factoring in 4.5 percent weft crimp and 2.5 percent selvage trim extends length per pick to 1.733 metres.
Total weft length reaches 4,852.4 metres. Divided by 67.72 metres per gram, this yields 71.6 grams of weft yarn per linear metre. Net combined yarn mass stands at 197.9 grams per linear metre, establishing base yarn material cost at 0.831 USD per linear metre.
Pushing thread densities near maximum reed capacity slows weaving speeds. High warp density causes friction between adjacent ends, increasing warp breaks. Mills offset lower operational efficiency by charging higher weaving tolls on dense constructions.
Weaves with longer floats require less insertion energy, though warp tension must be monitored more closely.

Loss
Moving from greige cost to finished fabric cost requires accounting for length shrinkage, weight shifts, width loss, and defect scrap during wet processing. Off-loom greige cloth differs sharply in appearance and dimensions from finished fabric on the cutting table. Bleaching, dyeing, mercerizing, printing, and stenter heat-setting alter both length and width; skipping these dimensional adjustments leads to understated finished fabric costs.
Linear yield drops directly as fabric shrinks in length during finishing. If a hundred-metre greige roll shrinks five percent during dyeing and finishing, only ninety-five linear metres reach inspection. Dividing the full cost of the original roll by ninety-five usable metres increases effective fabric cost per linear metre by 5.26 percent.
Width contracts alongside length: cloth woven at a 165-centimetre reed width may yield only 142 centimetres of usable width once edges are trimmed.
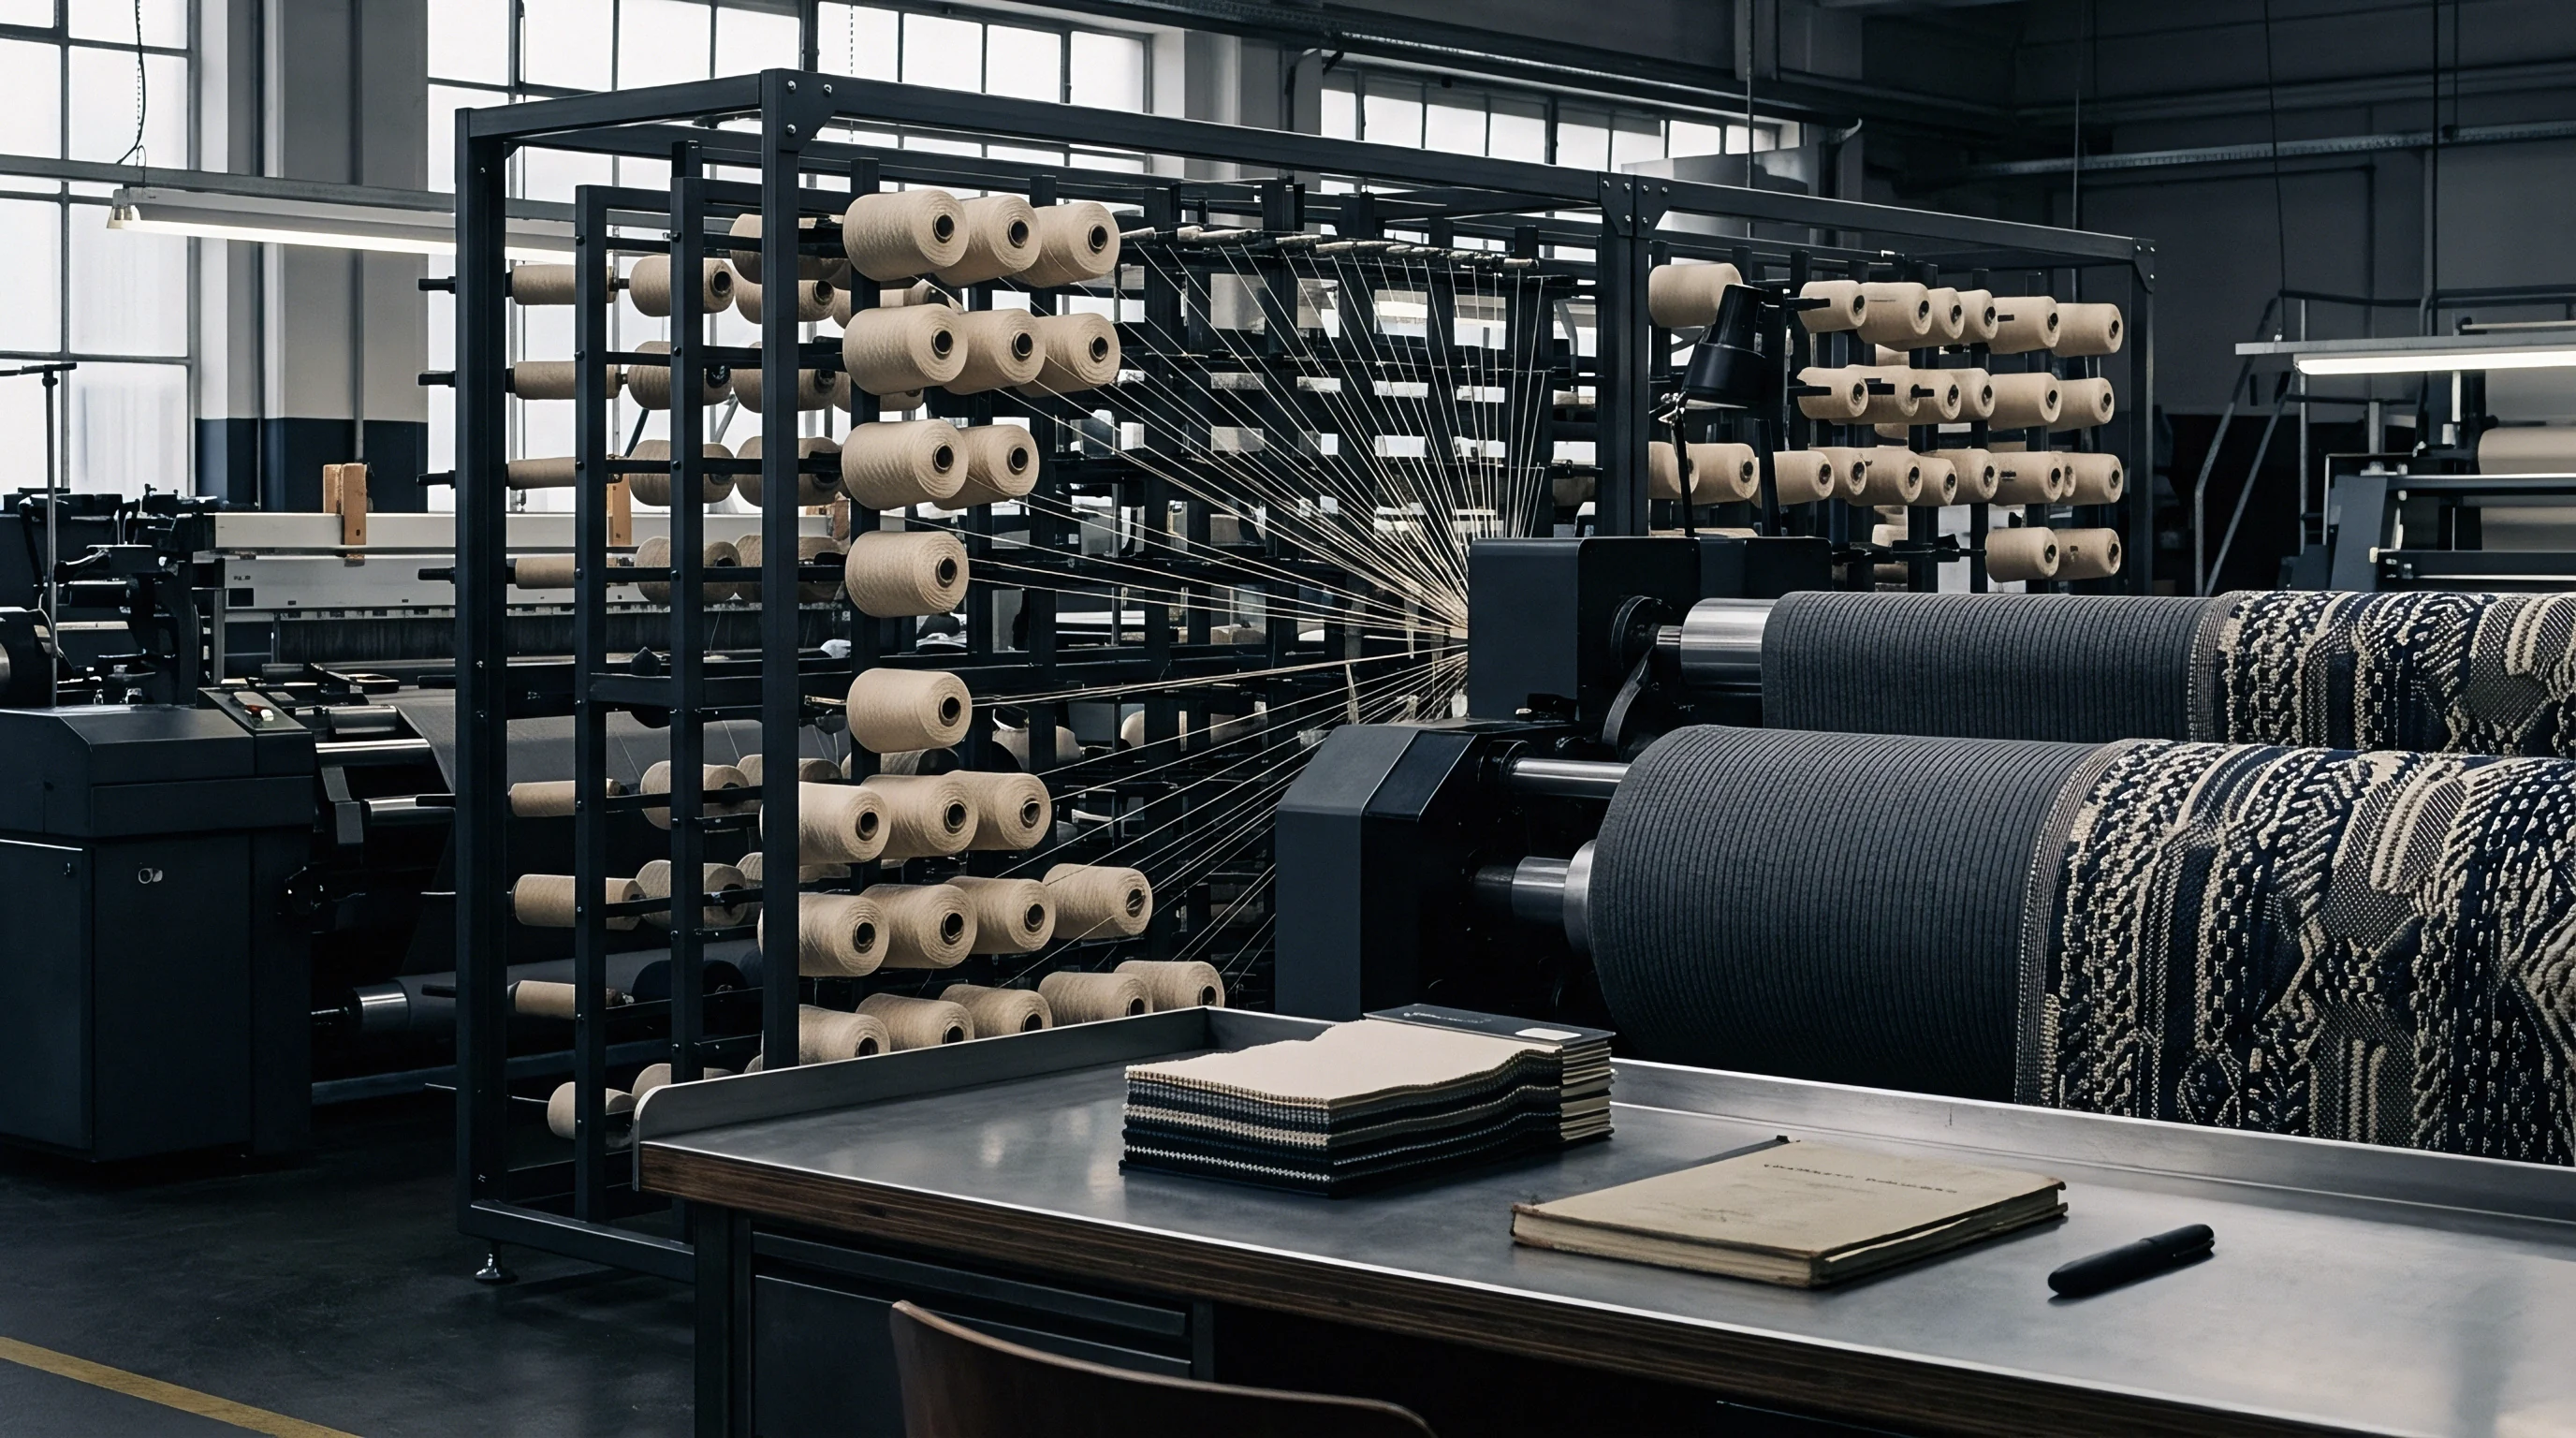
How Does Finishing Shrinkage Alter Yield Equations?
Dimensional shifts in wet finishing stem from tension relaxation, fibre swelling, and heat-setting. Cotton relaxes and shrinks during aqueous scouring and bleaching as internal weaving stress releases. Mercerizing under tension enhances luster and dye uptake, but subsequent washing and drying draw yarns closer together.
Synthetics like polyester shrink thermally on stenter frames, where temperatures reaching 190 degrees Celsius set and tighten the polymer structure.
Mass changes counter dimensional shrinkage during finishing. Desizing strips sizing agents, removing 8.0 to 12.0 percent of initial square-metre weight. Scouring eliminates natural waxes, pectins, and residual trash, removing an additional 3.0 to 5.0 percent.
Dyes, softeners, water repellents, and resin finishes subsequently restore mass. Final weight per square metre (GSM) reflects this balance between mass loss, chemical add-on, and fabric compaction. Costing models must evaluate net mass shifts alongside linear shrinkage.
- Measure exact greige roll length and square-metre weight before desizing and wet processing.
- Determine chemical mass loss percentages from desizing, scouring, and bleaching.
- Calculate length shrinkage by comparing post-stenter dry linear meters against the original greige roll length.
- Measure usable finished width inside pin-hole margins to calculate edge waste.
- Apply the net length yield factor to recalculate true greige material costs per finished linear metre.
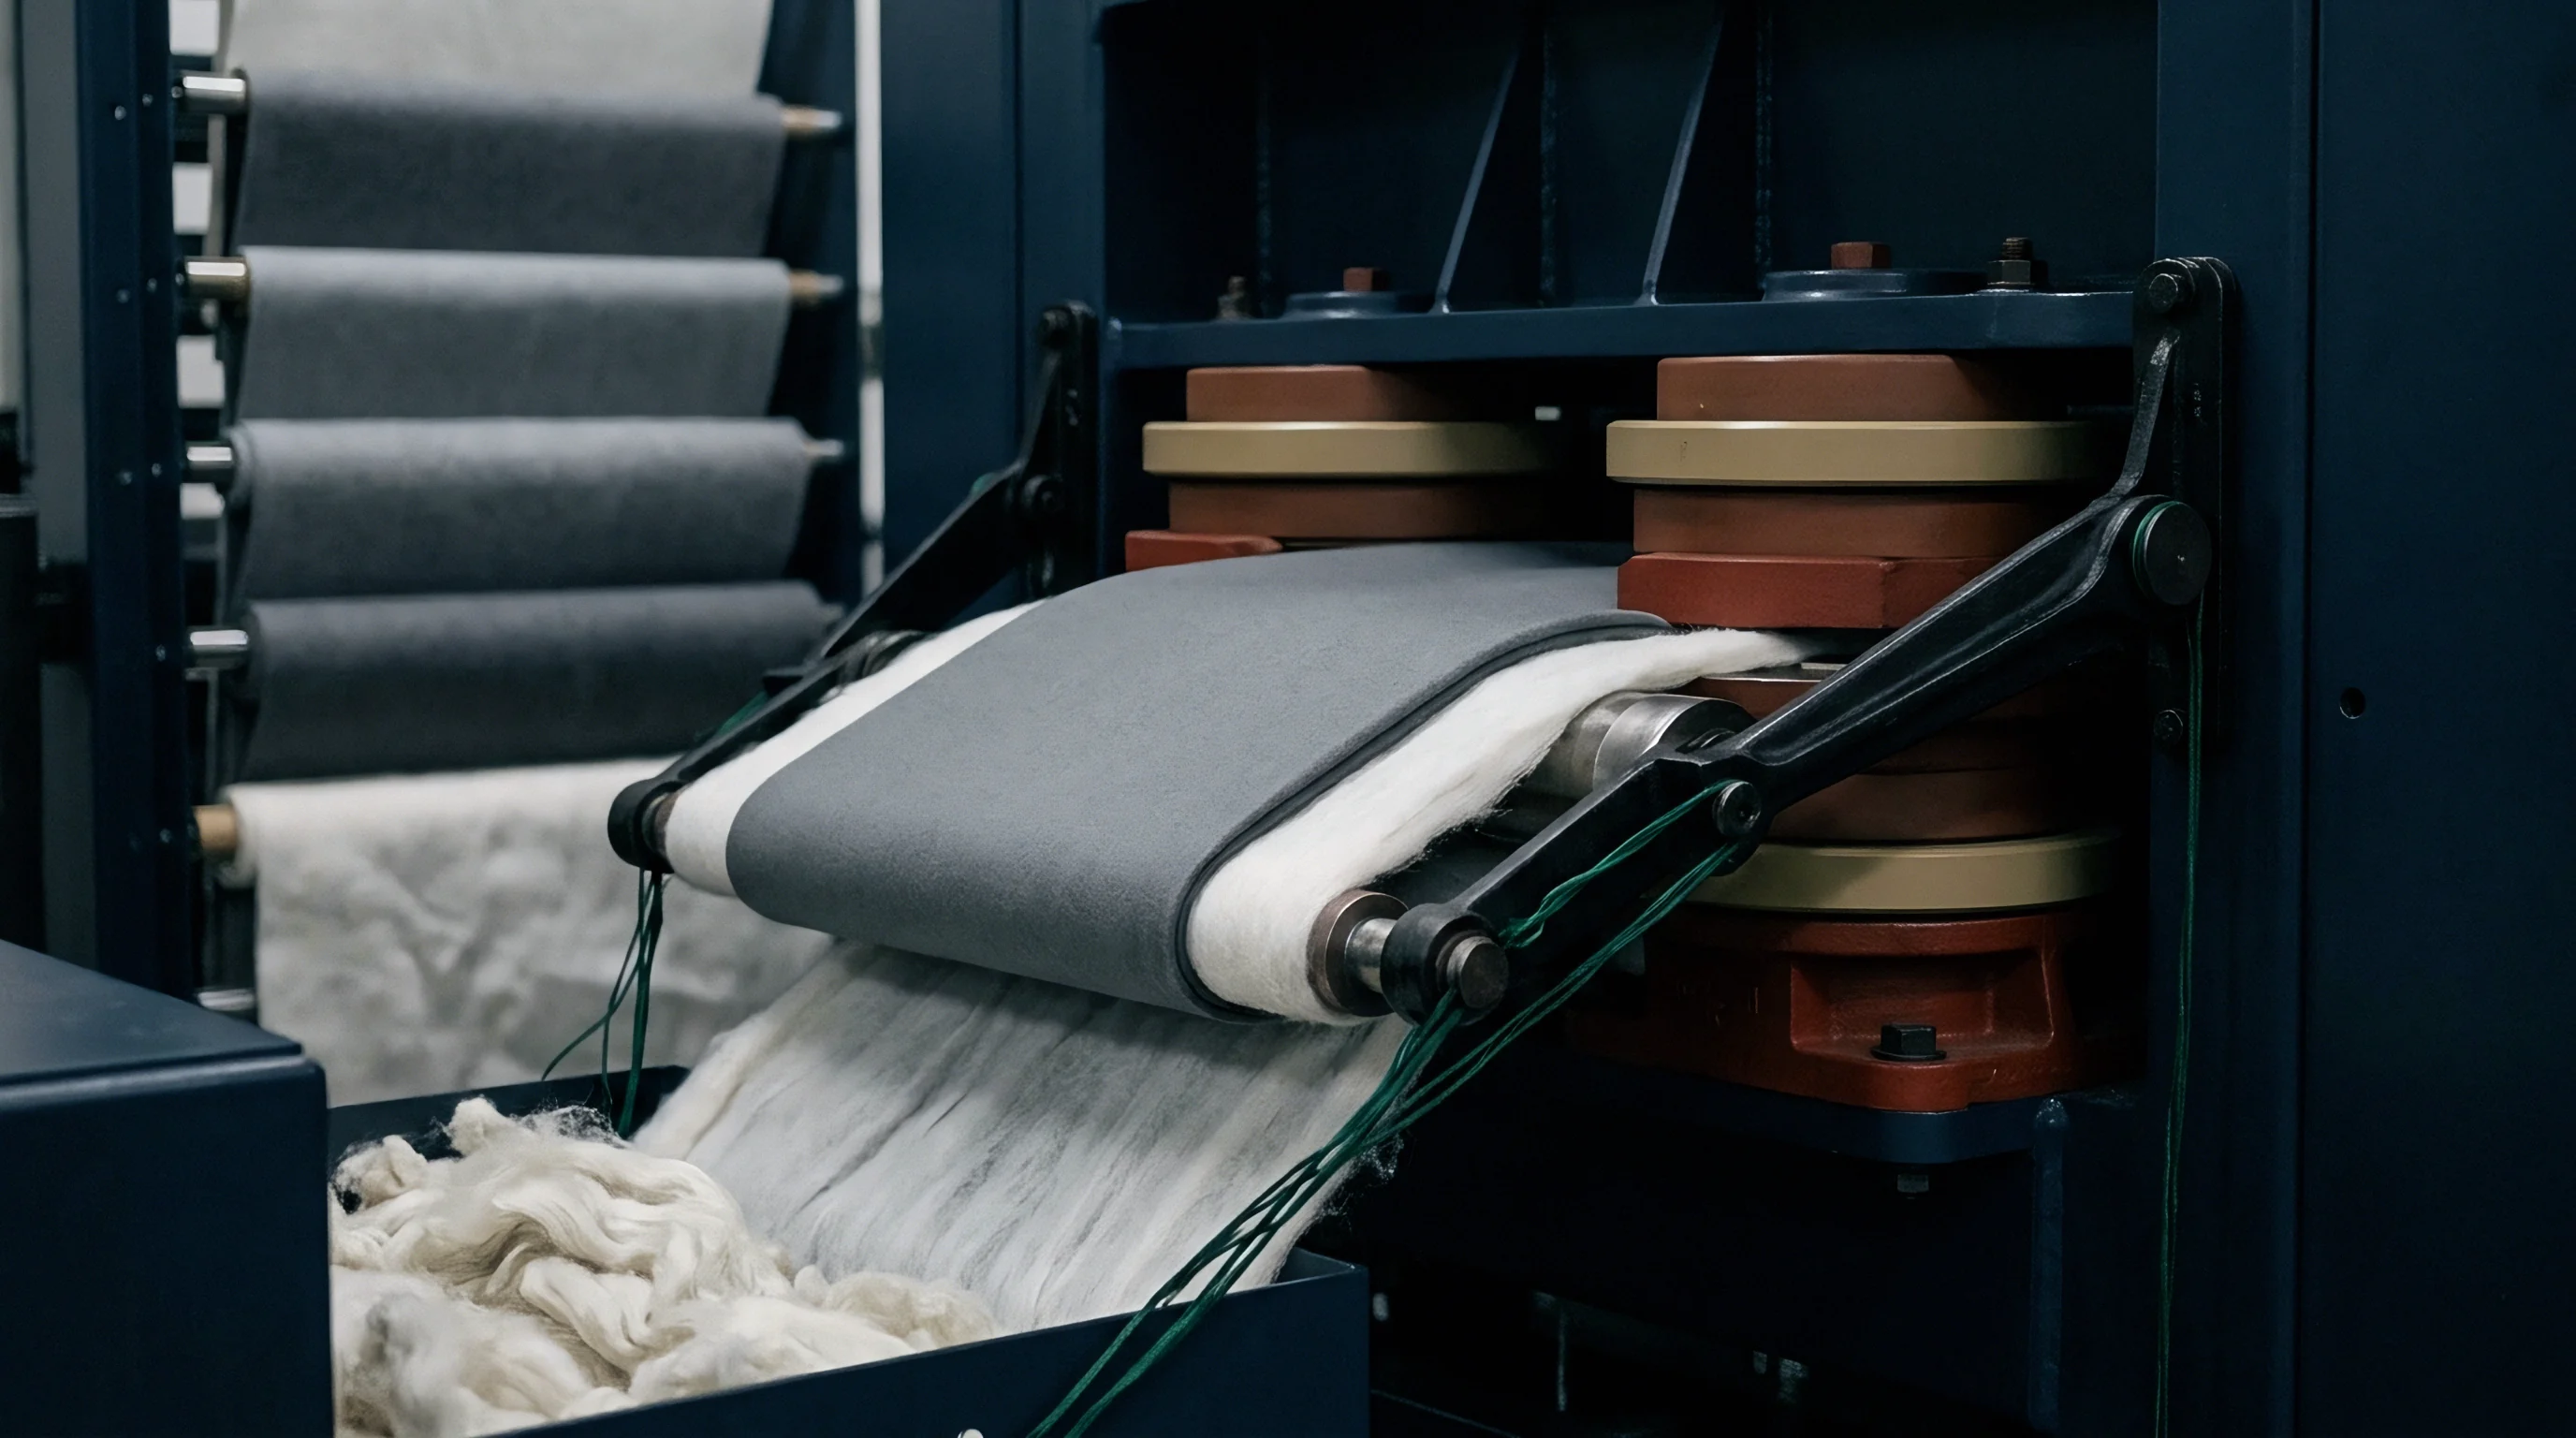
Selvage Scrap and Width Contraction Factors
Selvages stabilize edges during weaving and finishing, but become waste on the cutting table. Stenter pins or clips grip cloth edges to maintain width through high-temperature drying, piercing up to 1.5 centimetres inward on each side. Cutting rooms measure usable width strictly inside these pin-hole margins.
Purchasing fabric quoted at 150 centimetres gross width that yields only 142 centimetres of usable width reduces calculated marker efficiency.
Losing usable width increases the linear yardage needed per garment. Pattern markers depend on fixed width thresholds. If a layout requires 145 centimetres of usable width and delivered fabric measures 140 centimetres, the cutting room may need to change from a two-way marker to a single-panel layout.
That shift increases fabric consumption per garment by 15 to 25 percent. Contracts ought to specify minimum usable width rather than gross roll width.
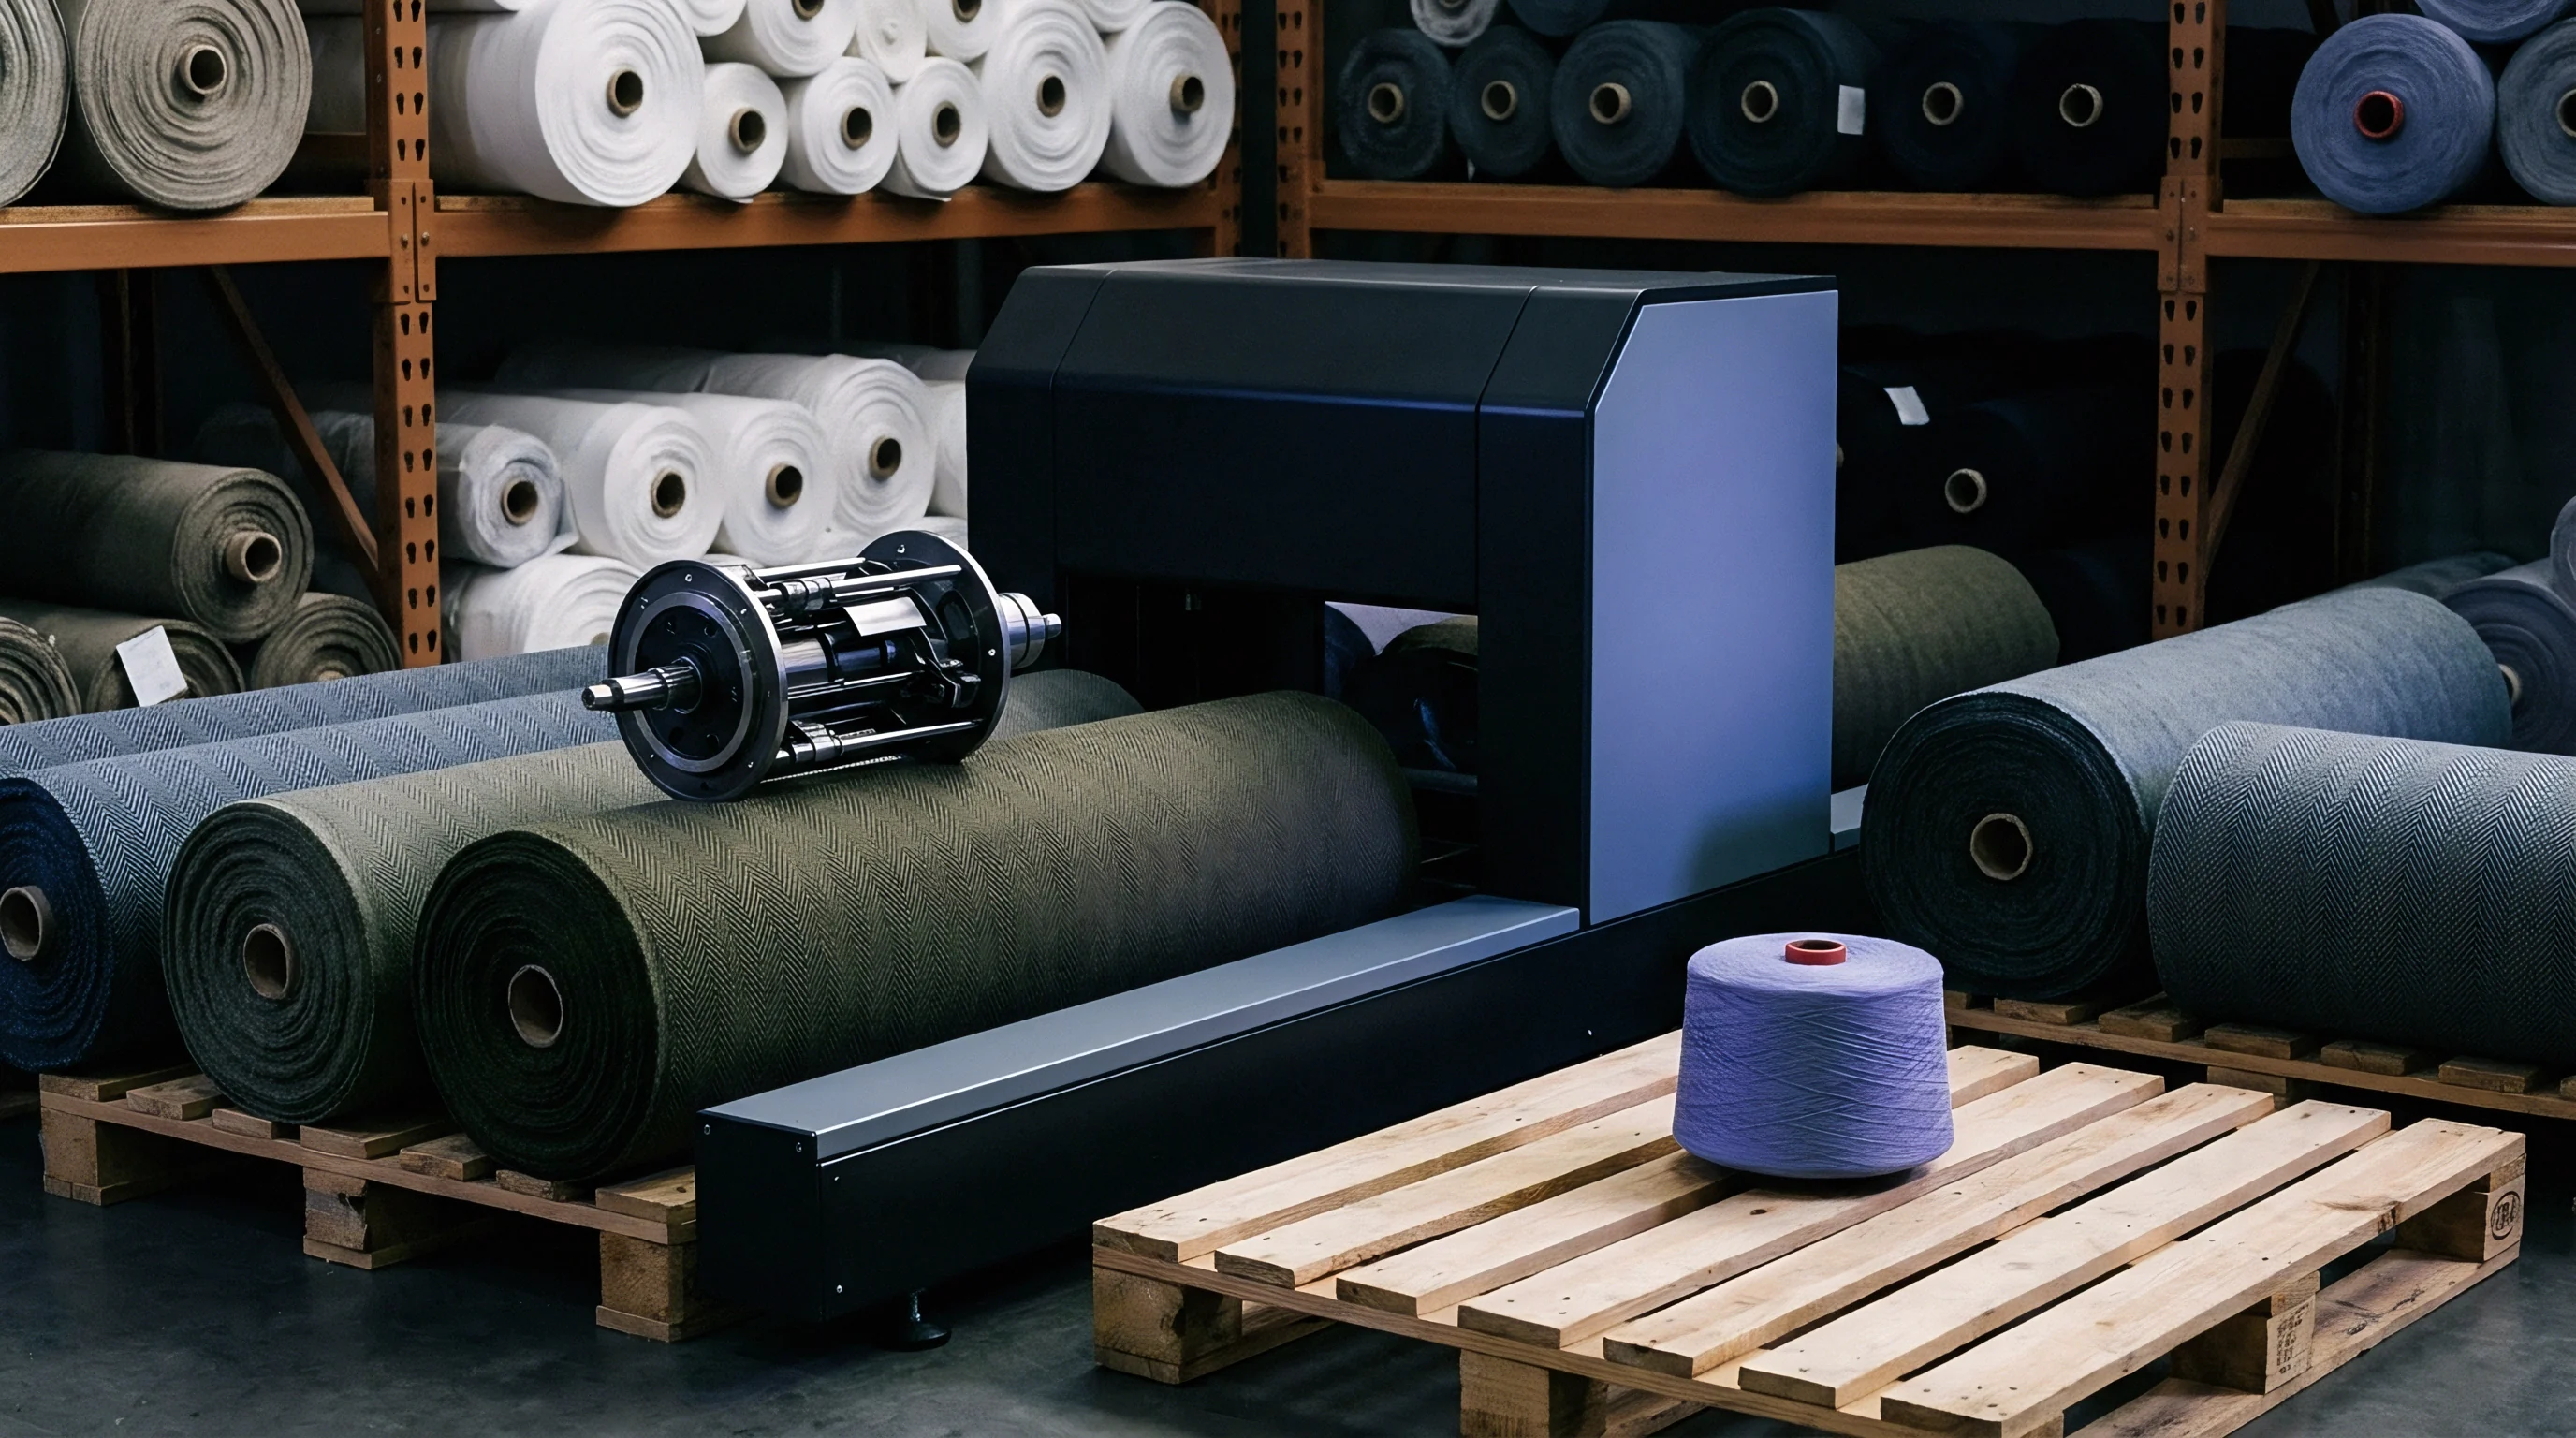
Defect Allowances and Cutting Room Utilization
Finished rolls inevitably contain defects such as slubs, thick ends, missing picks, dye streaks, and oil spots. Systems like ASTM D5430 (Four-Point System) quantify defect severity per hundred square metres. Industry standards permit mills to deliver rolls scoring up to 28 points per hundred square metres before penalty claims apply.
Spreading equipment must splice out or bypass these defects, consuming fabric that never reaches garment panels.
Marker utilization measures the proportion of purchased fabric that enters cut panels. Efficient automated layouts achieve 86 to 89 percent utilization on wide goods. Complex pattern shapes, plaid matching, directional prints, or narrow usable widths can reduce utilization to 75 percent or below.
Unused offcuts represent direct material loss. To convert finished fabric price into garment shell cost, divide linear fabric cost by the marker utilization percentage.
Standard ASTM D3776 weight tolerances of plus or minus three percent let weaving mills deliver lighter GSM weights while billing full contracted linear meters.
A 40,000-metre lot of un-sanforized cotton poplin once shrank seven percent in length during piece-dyeing instead of the expected four percent, wiping out operating margins across the garment order. Pre-production wet finishing shrinkage trials for every new weave protect against such unexpected yield drops before authorizing bulk production.

Tariff
Customs authorities convert physical fibre composition directly into duty rates at entry. Harmonized Tariff Schedule (HTS) codes assign duties based on chief weight, fibre origin, yarn construction, and weave structure. A blend ratio shift of two percentage points can reclassify a shipment from a low-duty HTS heading to a high-tariff classification.
Cost models that ignore blend-driven tariffs fail to reflect true landed costs per linear metre.
The General Rules of Interpretation (GRI) for the Harmonized System classify mixed-fibre textiles under the component that predominates by weight. Under Section XI Note 2, a fabric containing 51 percent cotton and 49 percent polyester is categorized under Chapter 52 as cotton. Reversing that blend to 51 percent polyester and 49 percent cotton moves classification to Chapter 55 as synthetic staple fabric.
Duty rate differences between these chapters are often substantial.
Customs Nomenclature and Chief Weight Thresholds
Determining chief weight requires quantitative chemical testing under standard laboratory protocols. Customs labs use ISO 1833 or AATCC 20A to verify declared compositions. In poly-cotton blends, selective dissolution uses concentrated sulfuric acid or 70 percent zinc chloride to dissolve cotton while leaving polyester intact.
The residual polyester is dried and adjusted for commercial moisture regain to calculate official mass percentages.
Customs authorities rely on lab test results rather than commercial contract targets. Invoices declaring a 50/50 poly-cotton blend present an immediate classification issue. Under Section XI rules, exact equal splits revert to the eligible HTS heading bearing the highest numerical code.
If lab testing on a declared 50/50 shipment shows 50.8 percent polyester and 49.2 percent cotton due to normal mill variance, customs reclassifies the entry under Chapter 55. That single shift alters duty rates, trade preference eligibility, and quota rules.

Blend Composition Variance and Duty Spreads
Duty spreads between natural and synthetic fibres remain wide in major importing markets. In the United States tariff schedule, 100 percent combed cotton fabric under HTS 5208.32 carries a 7.5 percent ad valorem duty. Plain weave 100 percent polyester filament fabric under HTS 5407.61 carries a 14.9 percent rate.
Blends with under 85 percent synthetic staple content frequently attract compound duties combining ad valorem percentages with specific cents-per-kilogram rates.
Free trade agreements establish additional rules regarding origin and composition. Rules of Origin under USMCA or CAFTA-DR enforce yarn-forward requirements, mandating that spinning, weaving, and finishing take place within member countries. When using non-originating synthetic staple, regulations cap non-originating fibre mass at seven to ten percent of total fabric weight.
Exceeding these thresholds eliminates duty-free eligibility and triggers full MFN rates across the entire shipment.
- Chief weight threshold crossings reclassify blended fabrics into higher duty chapters when mill variance shifts fibre percentages by as little as one percent.
- Yarn-forward origin failures disqualify shipments from free trade agreements when non-originating fibre content exceeds allowed limits.
- Incorrect moisture regain adjustments during testing distort dry mass ratios and trigger customs reclassification disputes.
- Inconsistent classification of filament versus staple synthetics leads to unexpected duty surcharges at entry ports.

Preferential Origin Rules and Value Add Benchmarks
Claiming preferential origin requires complete chain-of-custody documentation from raw fibre purchase through fabric inspection. Invoices must list blend percentages supported by lab test reports from bulk production. Regional value content (RVC) rules mandate that local processing costs and originating material values meet minimum percentage thresholds.
Sourcing decisions must balance cheaper non-originating fibre against potential loss of duty-free status.
Minor shifts in raw material sourcing can jeopardize trade preference compliance. Substituting imported non-originating viscose staple into a cotton blend to lower raw yarn costs may void duty-free eligibility for the finished fabric. The resulting duty penalty at destination frequently exceeds raw material savings by four to one.
Procurement teams require landed cost models that incorporate tariffs rather than relying solely on FOB fabric quotes.
Blowroom weigh-feeders operating within a tolerance of plus or minus three percent can push a declared 50/50 blend to 52 percent polyester. That three percent mechanical drift triggers a customs reclassification at destination, adding a 6.4 percent duty surcharge to the container.

Invoice
Integrating fibre selection, spinning yields, weaving costs, finishing shrinkage, and tariffs into a single landed-cost model gives buyers realistic financial control. Sourcing decisions cannot rely on simple spreadsheets that treat scrap and shrinkage as static figures. A comprehensive model evaluates sensitivity against fibre price swings, currency movements, yield variations, and freight shifts, establishing actual costs per finished metre before purchase orders are signed.
The cost bridge converts raw fibre pricing into landed fabric cost through six calculation steps. Step one determines moisture-corrected clean fibre cost per kilogram. Step two applies cumulative spinning yields and conversion tolls to set spun yarn cost per kilogram.
Step three uses fabric construction parameters, warp take-up, and weft crimp to establish greige yarn cost per linear metre. Step four incorporates finishing weight shifts, length shrinkage, and width contraction to find finished fabric cost per linear metre. Step five applies cutting room scrap allowances to calculate effective usable fabric cost.
Step six adds freight, insurance, tariffs, and port clearance fees to establish final landed cost per finished linear metre.
Consolidated Financial Cost Bridge Construction
Consider three representative workwear fabric specifications. Specification A uses 100 percent carded cotton. Specification B uses a 65/35 polyester/cotton blend.
Specification C uses 100 percent recycled filament polyester. All three target a finished usable width of 150 centimetres and a weight of 200 grams per square metre (GSM), yielding a net weight of 300 grams per linear metre.
Fibre prices reflect standard market benchmarks: raw upland carded cotton at 2.10 USD per kilogram, virgin polyester staple at 1.25 USD per kilogram, and recycled filament polyester at 1.65 USD per kilogram. The matrix below incorporates moisture regain corrections, spinning yields, weaving tolls, finishing shrinkage, and standard MFN tariffs.
| Cost Component / Parameter | Spec A: 100% Cotton | Spec B: 65/35 Poly/Cotton | Spec C: 100% Recycled Poly |
|---|---|---|---|
| Raw Fibre Purchase Price ($/kg) | $2.10 | $1.55 (Weighted) | $1.65 |
| Commercial Regain Factor | 1.085 | 1.032 | 1.004 |
| Corrected Raw Fibre Mass Cost ($/kg) | $2.28 | $1.60 | $1.66 |
| Spinning Yield % (Clean Yarn) | 87.4% | 93.2% | 98.5% |
| Effective Fiber Cost in Yarn ($/kg) | $2.61 | $1.72 | $1.69 |
| Spinning Transformation Toll ($/kg) | $1.40 | $1.15 | $0.45 (Texturing) |
| Total Spun Yarn Cost ($/kg) | $4.01 | $2.87 | $2.14 |
| Linear Yarn Mass Consumed (g/m) | 324.5g (8% Crimp) | 318.2g (6% Crimp) | 309.3g (3% Crimp) |
| Raw Yarn Cost per Linear Metre ($/m) | $1.30 | $0.91 | $0.66 |
| Weaving Conversion Toll ($/m) | $0.85 | $0.75 | $0.60 |
| Greige Fabric Cost ($/m) | $2.15 | $1.66 | $1.26 |
| Wet Finishing Cost & Yield Adj ($/m) | $0.62 (5% Length Shrink) | $0.48 (3% Length Shrink) | $0.35 (1% Length Shrink) |
| Finished Fabric FOB Price ($/m) | $2.77 | $2.14 | $1.61 |
| Freight & Insurance per Metre ($/m) | $0.12 | $0.12 | $0.12 |
| Customs Duty Rate % (Import Tariff) | 7.5% (Chapter 52) | 12.0% (Chapter 55) | 14.9% (Chapter 54) |
| Customs Duty Amount ($/m) | $0.21 | $0.26 | $0.24 |
| Final Delivered Cost ($/Finished Metre) | $3.10 | $2.52 | $1.97 |

Sensitivity Analysis across Fibre Prices and Yield Rates
Sensitivity analysis demonstrates how key variables affect landed fabric costs. For Specification A (100 percent cotton), a ten percent increase in raw cotton adds 0.21 USD per kilogram. Factoring that increase through spinning yield, yarn count, crimp, and finishing shrinkage adds 0.08 USD per finished linear metre ~ a 2.58 percent shift in total landed cost.
Raw material price swings are diluted as fixed conversion tolls represent a larger portion of total cost.
Variations in finishing shrinkage exert a pronounced effect on final cost. If inconsistent tension control during dyeing increases Specification A’s length shrinkage from five percent to nine percent, usable yield drops immediately. That four percent yield loss adds 0.12 USD per linear metre to finished fabric cost ~ exceeding the impact of a ten percent increase in raw cotton prices.
Controlling physical yields requires the same focus as negotiating raw material pricing.

Freight Insurance and Payment Term Financing Costs
Freight, marine insurance, port charges, and capital financing represent the final additions to landed cost. Ocean freight is billed on gross shipping weight, which includes fabric rolls, cardboard cores, and protective wrapping. Cores and packaging add three to five percent deadweight to shipments.
Paying freight on tare weight increases landed cost per net usable metre.
Financing expenses accumulate over extended production cycles. Purchasing raw fibre sixty days prior to spinning, followed by thirty days of weaving, twenty days of wet finishing, and thirty days of ocean transit commits working capital for four months. At a six percent annual cost of capital, a 120-day production timeline adds approximately 2.0 percent in carrying costs to finished fabric value.
Costing models must incorporate capital carry fees to protect operating margins.
Freight calculations based on gross bale weight understate landed fabric costs when finishing shrinkage reduces total usable linear yield.
How will pending carbon-border adjustment mechanisms translate direct and indirect processing emissions per kilogram of imported synthetic yarn into tariff surcharges across trade corridors?

Audit
Verifying blend percentages, yarn counts, and usable dimensions requires structured laboratory testing prior to commercial settlement. Relying on unverified supplier declarations exposes buyers to quality non-conformance, cutting room yield losses, and customs penalties. An audit framework establishes clear sampling rules, defines lab testing tolerances, and sets binding retest procedures for resolving disputes.
Sampling procedures must extract representative cuts across an entire shipment. ISO 5089 requires taking swatches from multiple rolls distributed throughout the container. Technicians cut full-width swatches at least one metre in from roll ends to avoid edge distortion or handling damage.
Samples undergo conditioning for twenty-four hours in standard test atmospheres before measuring mass per square metre under ISO 3801 or yarn count under ISO 2060.

Laboratory Testing Protocols for Mass Verification
Quantitative chemical analysis separates blended fibres to verify composition under ISO 1833. For poly-cotton blends, technicians dissect warp and weft yarns before dissolving the cotton in cold 70 percent zinc chloride or hot concentrated formic acid. The insoluble polyester residue is washed, dried, and weighed on balances accurate to 0.1 milligrams.
Commercial regain factors are then applied to calculate official component percentages.
Determining yarn count from woven samples requires removing crimp in accordance with ISO 7211-3. Technicians extract twenty warp and twenty weft yarns from conditioned swatches, apply standard tension weights to straighten crimp without stretching the fibre, and record extended length. The yarns are weighed on analytical balances to calculate actual tex or Ne counts.
Comparing extracted counts against contract specifications determines whether a mill is lightweighting yarn to reduce raw material usage.
Managing Composition Disputes and Retest Tolerances
Commercial contracts must distinguish manufacturing tolerances from laboratory testing variance. ISO 1833 establishes an analytical test tolerance of plus or minus 2.0 percent for two-fibre blends. If a contracted 60/40 poly-cotton fabric tests at 61.8 percent polyester, the result falls within standard lab tolerance.
Retest clauses should trigger only when test results deviate by more than 2.5 percentage points from contract specifications.
If initial testing indicates non-compliant blend ratios or fabric weights, arbitration provisions take effect. Standard contract terms require sending sealed referee swatches ~ drawn during joint sampling ~ to an independent ISO/IEC 17025 accredited laboratory. The referee laboratory’s findings serve as binding evidence for settlement.
If the referee laboratory confirms a deviation resulting in a higher tariff classification, the supplier covers all retest fees, customs surcharges, and landed cost differentials.
Mandatory pre-shipment lab audits protect buyers against blend drift and unannounced weight reductions. Integrating verified clean yields, exact crimp factors, usable widths, and tariff liabilities into a single financial model translates raw fibre price tracking into effective cost control on the cutting room floor.