High Volume Instrument Micronaire Corrections for High Speed Ring Spinning
Correcting HVI micronaire values for ambient temperature, pressure, and moisture regain prevents dynamic yarn strength failure in high-speed ring spinning.

Airflow
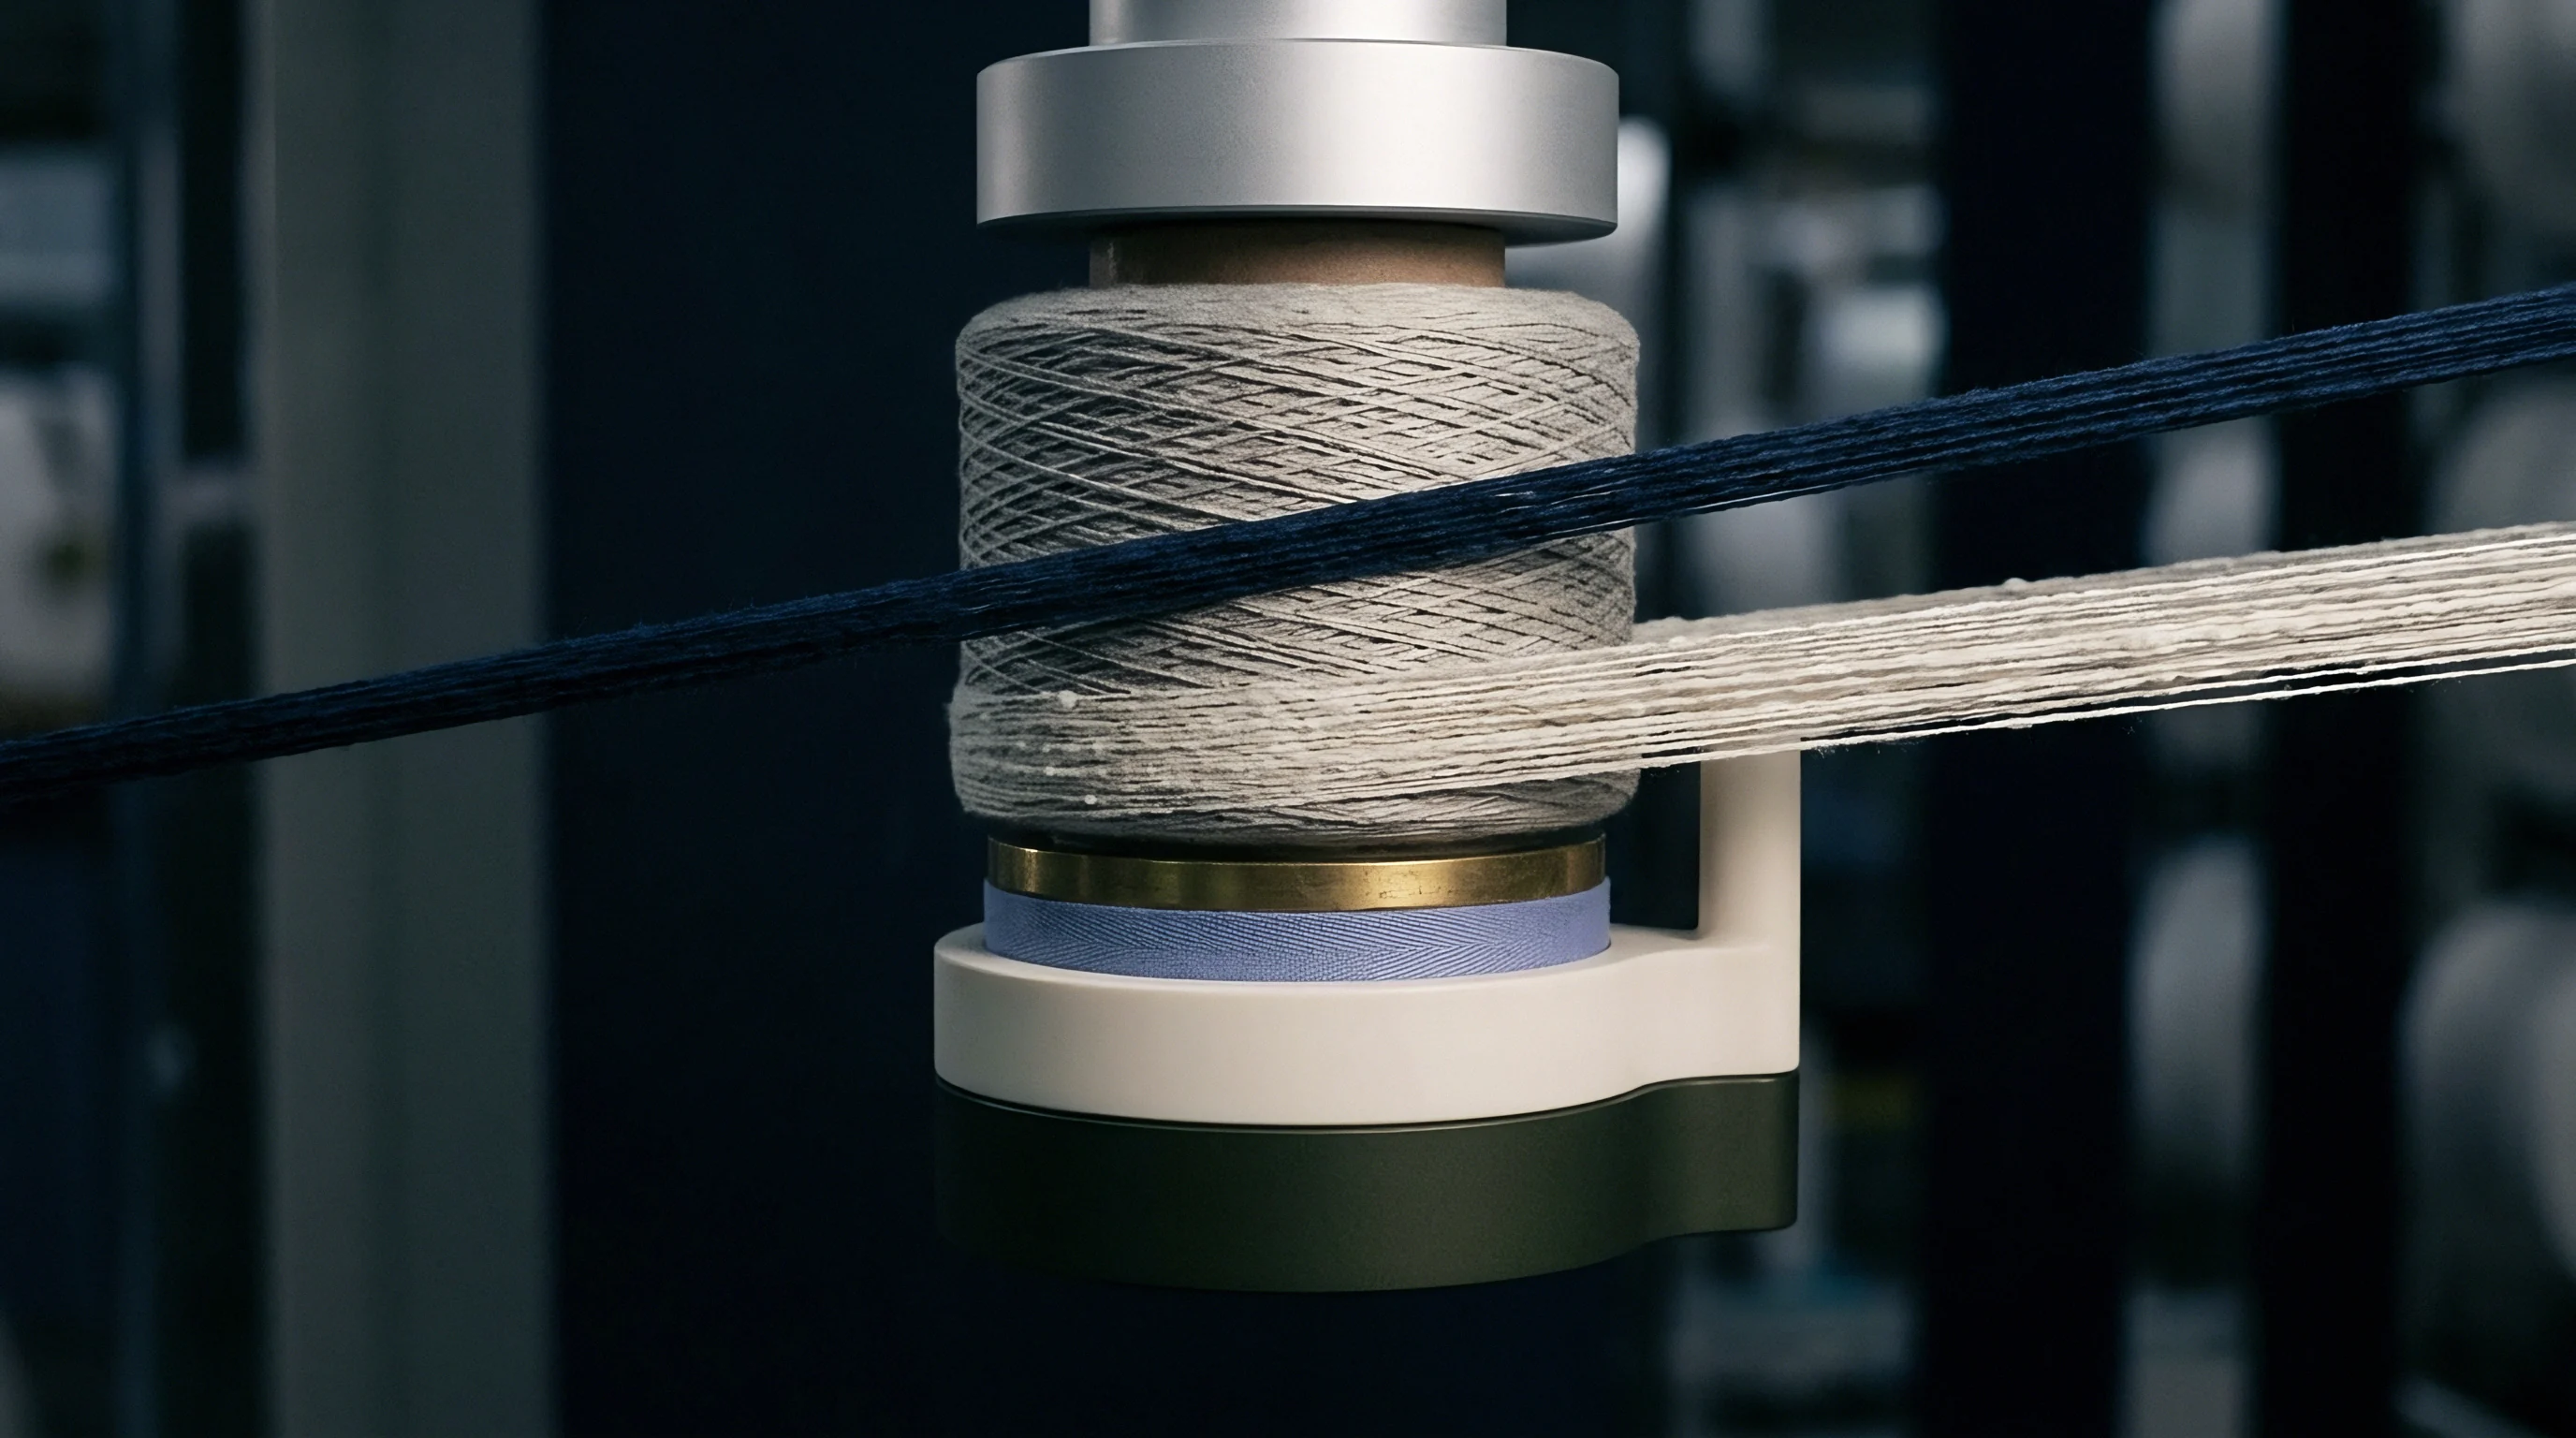
Measuring cotton fiber fineness and maturity pneumatically relies on forcing a regulated air stream through a fixed mass of compressed raw fiber inside a test chamber. High Volume Instrument systems run this test by measuring pressure drop across a 10.00-gram fiber plug packed into a cylinder of known volume, following standardized parameters in ASTM D1448 and ISO 2403. Airflow resistance scales non-linearly with total fiber surface area inside the chamber.
Finer fiber diameters or collapsed cell walls offer more total surface area per unit mass, restricting airflow and creating a higher differential pressure drop. Coarse or highly mature fibers offer less resistance, yielding a lower pressure drop and a higher raw micronaire reading.
Air permeability through packed porous media follows Carman-Kozeny hydraulic radius theory, where specific surface area per unit volume dictates viscous resistance to laminar airflow. In high-speed ring spinning mills targeting fine counts like Ne 40, Ne 50, or Ne 60, slight shifts in micronaire alter how many fibers sit in the yarn cross-section. A difference of 0.3 micronaire units changes that count by twelve to fifteen fibers in fine yarns, directly affecting drafting force stability and end-down rates on spindles running over 18,000 RPM.
Raw instrument data that ignores air density fluctuations, ambient relative humidity, and sample moisture regain introduces systematic errors into bale laydown algorithms.

HVI Pneumatic Chamber Dynamics
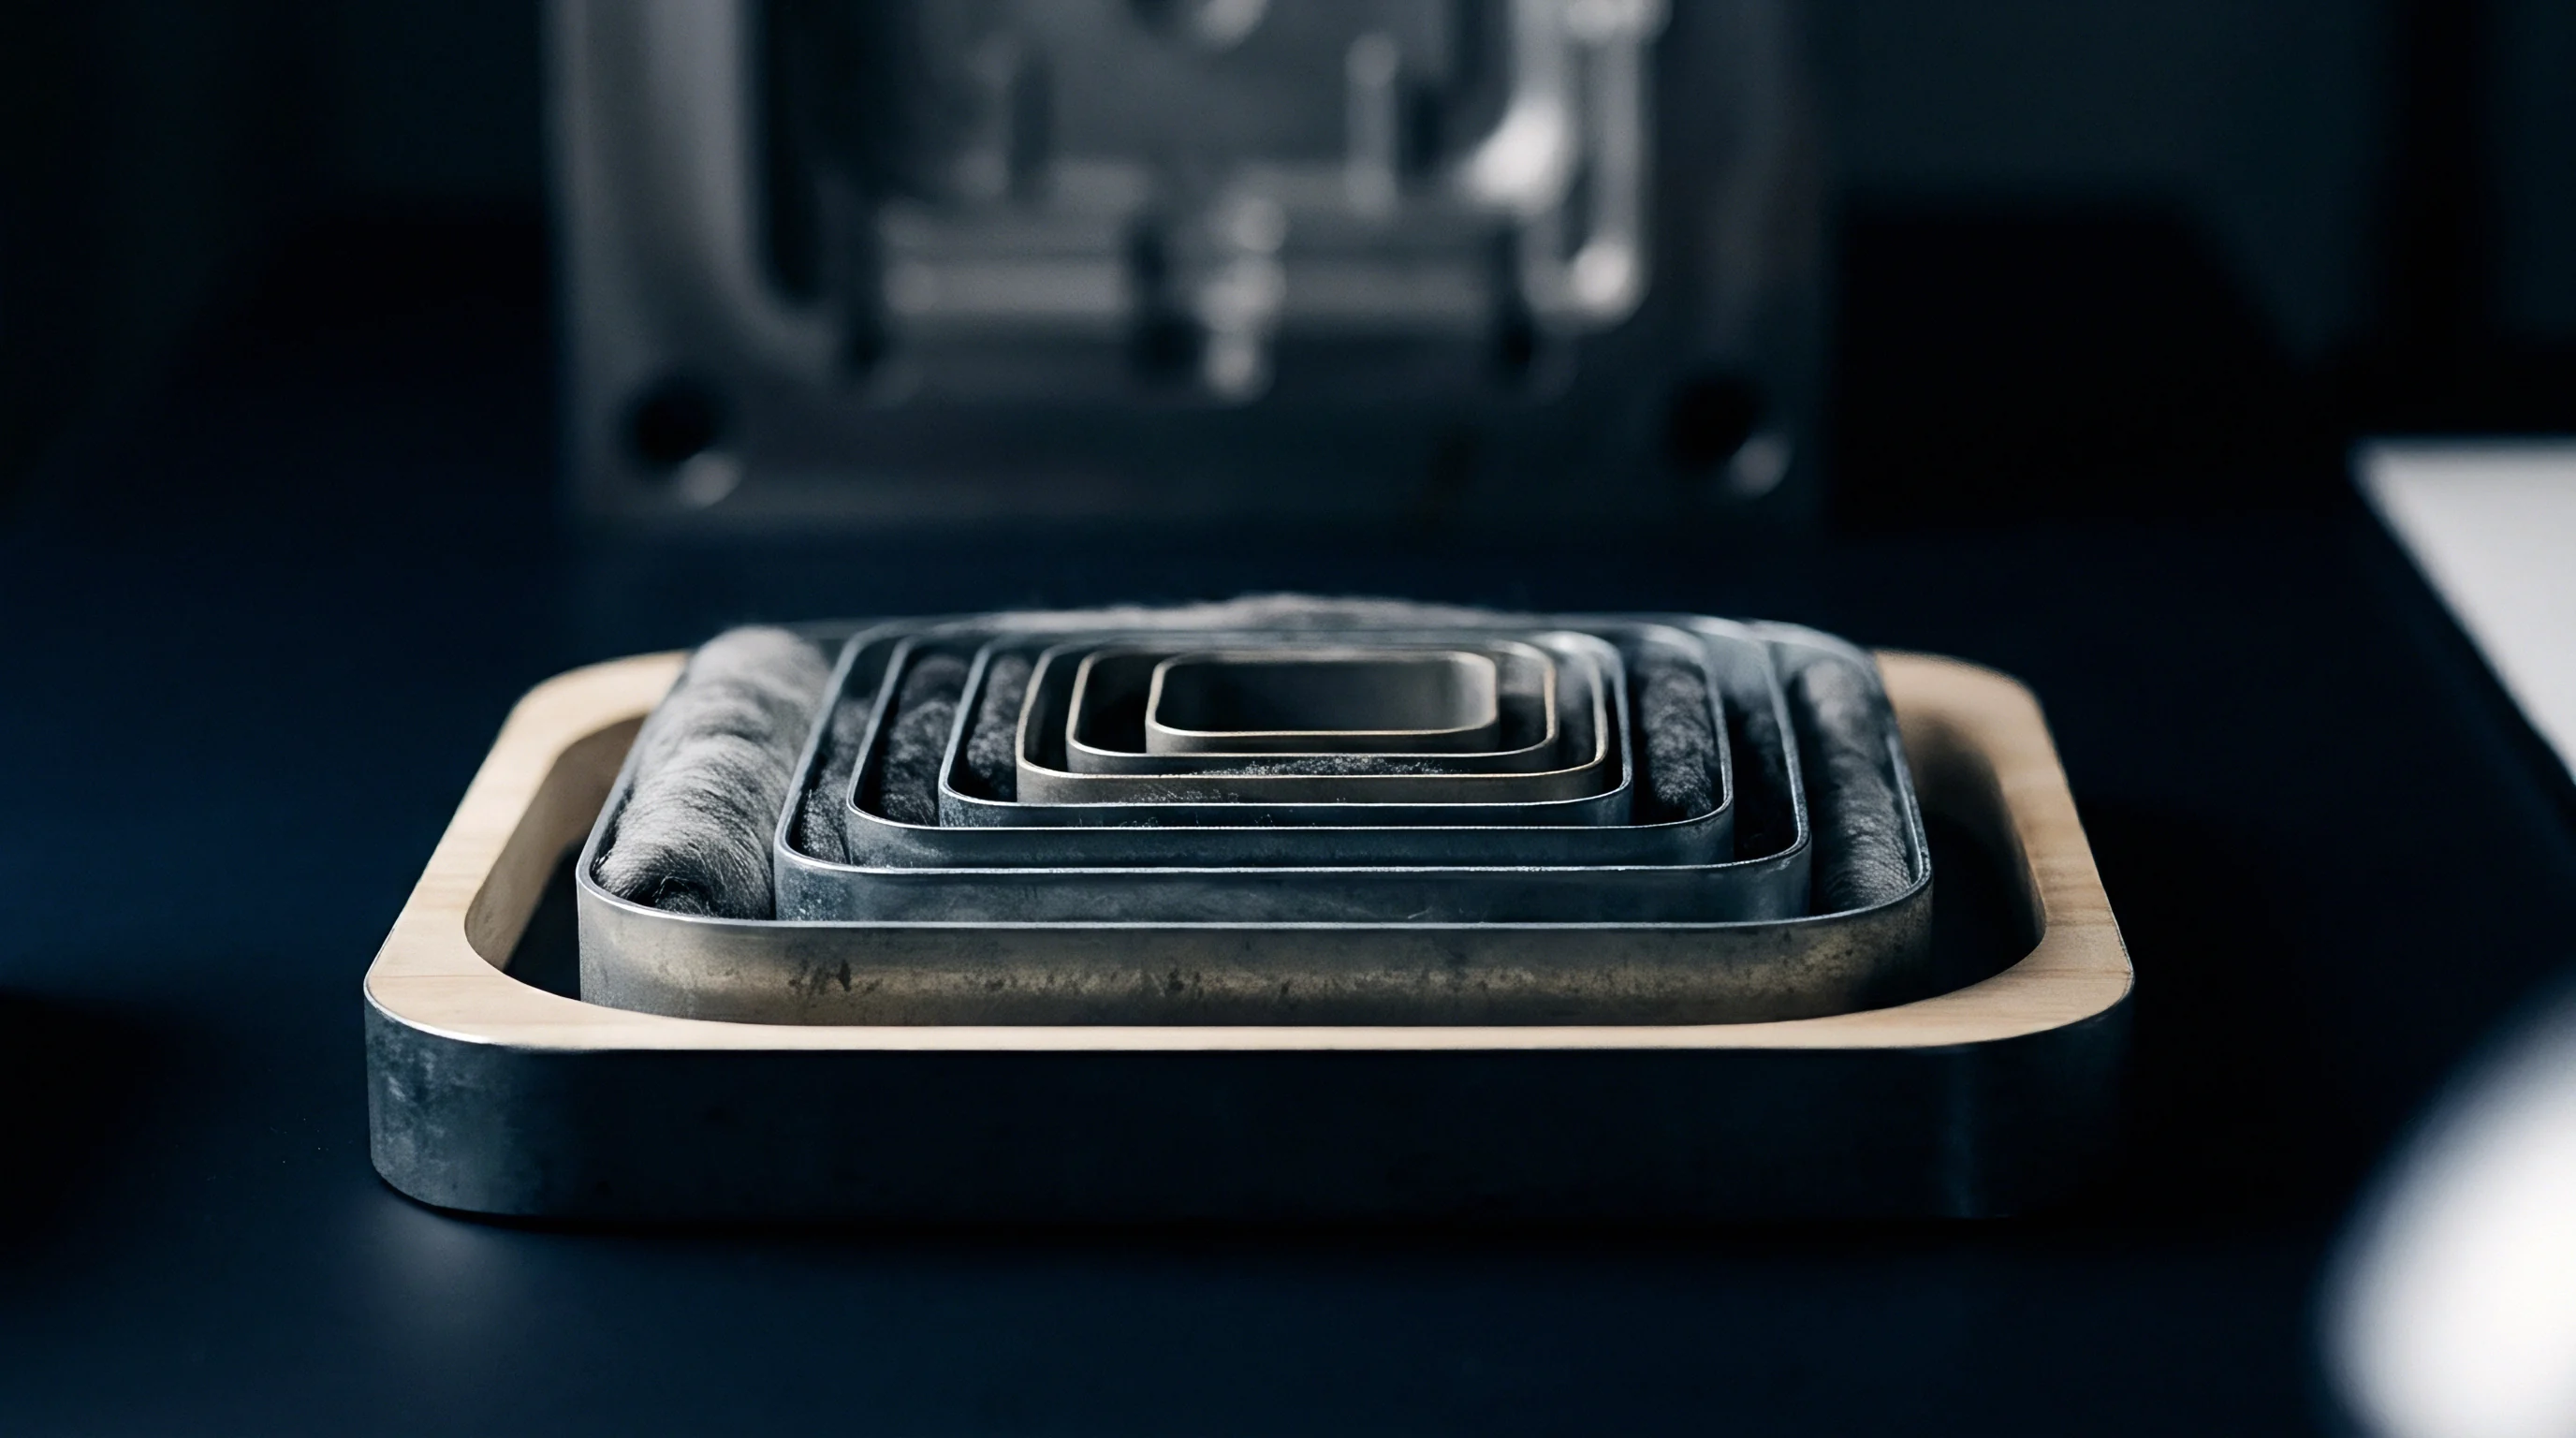
The testing cycle on modern automated HVI lines compresses the specimen using a motorized pneumatic piston under standard parameters requiring either constant air volume or constant differential pressure across the plug. Chamber geometry forces randomly oriented fibers into a compressed matrix, though uneven packing density across the cylinder can leave localized channels of lower resistance. Variations in crimp and moisture alter how individual tufts yield under load, changing the effective porosity of the plug.
| Parameter Type | Nominal Value | Standard Tolerance | Operational Impact of Variance |
|---|---|---|---|
| Specimen Mass | 10.00 g | ± 0.05 g | Mass errors skew compressed plug density and surface area ratio. |
| Chamber Volume | 54.3 cm³ | ± 0.20 cm³ | Alters volumetric packing fraction and differential pressure calibration. |
| Airflow Volume Rate | 40.0 L/min | ± 0.5 L/min | Flow rate shifts alter laminar-turbulent transition within fiber mass. |
| Differential Pressure Range | 20 to 80 kPa | ± 0.2 kPa | Direct sensor signal converting to empirical micronaire scale. |
Pneumatic transducers convert mechanical air resistance into an electrical signal, which instrument software maps against International Calibration Cotton Standards using loaded calibration curves. Residual wax, pectin, or botanical trash on raw cotton changes fiber surface friction and shifts flow channel dimensions inside the plug. In testing un-scoured, high-stickiness cotton lots under erratic lab temperatures, raw airflow readings drifted by up to 0.25 units.
Relative humidity fluctuations inside the testing laboratory shift sample moisture regain, directly expanding fiber cross-sections and distorting raw airflow differential pressure readings.
Thermodynamic and Regain Sensitivity in Porous Plugs
Cellulose expands as it absorbs atmospheric moisture. Cotton regain typically ranges from 6.0 percent to 8.5 percent under standard lab conditions of 21 ± 1 °C and 65 ± 2 percent relative humidity per ASTM D1776. Absorbed moisture increases fiber cross-sectional perimeter while softening the cellulosic matrix.
This expansion narrows interstitial channels in the HVI chamber, increasing air resistance so that an unconditioned sample with high moisture regain reads artificially low on micronaire.
Thermal gradients between incoming bales and the lab environment make measurement errors worse. Bales moved straight from unconditioned warehouses hold their temperature for days; cool fibers condense moisture on instrument valves and shift air density inside the test chamber. Calibration routines must apply real-time barometric pressure and ambient temperature corrections to raw pressure data before writing values to the bale selection database.
Internal sensor offsets do not automatically negate ambient relative humidity shifts up to eight percent without manual recalibration or specimen pre-conditioning.
Maturity
Cellular development in the cotton boll determines the ratio between cell wall thickness and total fiber diameter. Because micronaire combines linear density and maturity into one empirical index, it leaves their individual contributions ambiguous: a low reading can mean fine fibers with thick walls or coarse fibers with paper-thin, undeveloped walls. In high-speed ring spinning mills, immature fibers in the blowroom trigger severe quality issues because thin-walled fibers roll into persistent neps and cause dye shading defects in finished fabric.
Maturity Ratio measures secondary wall thickening against a circular cross-sectional model. A ratio of 1.00 indicates a fully developed wall where wall area equals half the area of a circle with the same perimeter; values below 0.75 signal severe immaturity typical of dead fibers. High-speed ring frames running traveler speeds over 38 meters per second cannot tolerate high proportions of low-maturity fiber without generating excessive fly and traveler loading.
| Maturity Classification | Maturity Ratio (MR) | Degree of Thickening (theta) | Linear Density Range (dtex) | Ring Spinning Suitability |
|---|---|---|---|---|
| Mature / Developed | 0.90 – 1.10 | 0.60 – 0.80 | 1.30 – 1.70 | Optimal for speeds above 20,000 RPM. |
| Average Development | 0.80 – 0.89 | 0.50 – 0.59 | 1.15 – 1.29 | Standard operation for medium counts. |
| Immature / Thin-Walled | 0.70 – 0.79 | 0.40 – 0.49 | 0.95 – 1.14 | High nep risk, reduced spindle speeds. |
| Dead / Undeveloped | Below 0.70 | Below 0.40 | Below 0.95 | Unusable for high-speed fine yarn counts. |
Decoupling Linear Density from Cell Wall Thickness
Separating biological wall thickness from geometric perimeter takes multi-stage physical or optical analysis. Gravimetric fineness, measured in millitex or decitex, gives the actual weight per unit length. Fine, highly mature fiber combines structural strength with cross-sectional flexibility, allowing smooth attenuation through the drafting zone while maintaining enough inter-fiber contact points to prevent slippage.
Coarse, immature fibers can carry the exact same raw micronaire reading as fine, mature fibers, but they process completely differently. Coarse immature fibers buckle under drafting rollers, causing fiber rupture and generating short fibers. Fine mature fibers bend smoothly around drafting aprons and compact tightly into the yarn core during twisting.
Relying on raw micronaire alone without isolating maturity leads to unpredictable strength indices and erratic yarn hairiness on high-speed ring frames.
Spectroscopic and Double Compression Verification
Advanced diagnostic lines use dual-stage pneumatic compression or near-infrared spectroscopy to isolate maturity from linear density. Double-compression HVI attachments test specimens at two different volumetric packing densities; software models then calculate fiber perimeter and Maturity Ratio from the pressure drops at low and high compression using modified Lord equations.
Near-infrared spectroscopy analyzes light absorption across wavelengths matching cellulose hydroxyl stretching bands, where higher relative absorption correlates directly with total cellulosic mass regardless of fiber surface area. Automated image analysis of fiber cross-sections by microscopy remains the primary standard under ASTM D1444, measuring wall area and perimeter directly. Labs turn to these secondary methods whenever raw micronaire drops below 3.5 or exceeds 4.9.
ASTM D1444 cross-sectional optical analysis provides the definitive benchmark for cell wall ratio measurements when dual-compression pneumatic estimates return ambiguous maturity indices.
Whether double-compression algorithms can completely eliminate the influence of surface coatings during high-throughput grading remains an open question for mill quality control teams.

Drafting
The drafting zone of a high-speed ring frame pulls the roving strand at mechanical draft ratios from 30 to 50. Front roller delivery speeds above 25 meters per minute require consistent inter-fiber friction and cohesive assembly. Fiber linear density dictates how many fibers sit within the drafting nip line at any instant.
When low-micronaire immature fibers enter the zone, their low flexural rigidity leads to irregular drafting, creating periodic mass variations known as drafting waves.
Dynamic tension during ring twisting places heavy mechanical demands on the emerging spinning triangle. High spindle speeds generate centrifugal force that translates into high threadline tension between traveler and bobbin. If the fiber count in the cross-section drops because coarse, high-micronaire fibers enter the strand, yarn tensile strength falls below what is needed to withstand traveler drag, causing immediate thread breaks.
Inter-Fiber Friction and Fiber Cross-Sectional Density
Yarn strength depends on cohesive friction between adjacent fibers to translate individual fiber tenacity into overall yarn strength. The average number of fibers in a yarn cross-section calculates directly from yarn linear density and average fiber linear density:
N = (590.5 / Ne) / (Micronaire x 0.394)
Where N represents the fiber end count, Ne is the English Cotton Count, and the denominator converts micronaire to approximate linear density in tex. Keeping a minimum of 75 to 80 fibers in the yarn cross-section prevents structural failure during drafting. Spinning an Ne 50 yarn with cotton at a corrected micronaire of 4.5 leaves only 66 fibers in the cross-section, leading to high end-down rates and broad yarn strength distribution CV percentages.
Inter-fiber friction depends on surface wax content and available surface area. Fine fibers present a larger aggregate contact surface per unit weight, enhancing frictional restraint during apron drafting. This cohesion prevents fibers from slipping prematurely ahead of the main drafting wave, minimizing thin places and reducing Classimat long-thin faults.

Traveler Speeds and Dynamic End-Down Frequencies
Modern ring spinning machines run spindle speeds up to 22,000 RPM, translating to traveler velocities exceeding 40 meters per second against the steel ring. Frictional heat on the ring surface raises traveler temperature, softening the metal and accelerating wear. Immature low-micronaire fibers shed short fiber fragments and surface debris during drafting, which accumulate in the traveler wire gap, altering traveler mass and dynamic balance.
| Yarn Count (Ne) | Target Spindle Speed (RPM) | Optimum Micronaire Range | Fibers in Cross-Section | Expected End-Downs per 1000 Spindle-Hours |
|---|---|---|---|---|
| Ne 30 Combed | 21,500 | 4.0 – 4.4 | 112 – 123 | 12 – 18 |
| Ne 40 Combed | 19,500 | 3.8 – 4.1 | 91 – 98 | 15 – 22 |
| Ne 50 Combed | 18,000 | 3.6 – 3.9 | 78 – 85 | 20 – 30 |
| Ne 60 Combed | 16,500 | 3.4 – 3.7 | 73 – 79 | 28 – 42 |
Poor micronaire control in laydown preparation leads to traveler loading, increased hairiness, periodic mass variations, and severe spikes in end-down rates across high-speed ring frames. When average lot micronaire drifts upward by 0.4 units without adjusting drafting roller gauge settings, end-down rates routinely jump above 50 breaks per 1000 spindle-hours, crippling ring frame efficiency.
Mismatched fiber linear density and drafting zone nip settings cause high yarn count variance, lost efficiency, and financial penalties on delivered yarn contracts.

Correction
Pneumatic differential pressure values from HVI instruments require mathematical correction before integration into spinning mill execution systems. Environmental drift, operator loading variation, and sample moisture regain shift raw airflow metrics. Software algorithms use empirical correction polynomials to map measured pressure drops back to standard reference scales set by International Calibration Cotton Standards.
Moisture compensation formulas calculate corrected micronaire by measuring specimen regain using integrated acoustic, NIR, or electrical capacitance sensors before pneumatic compression. This correction offsets volumetric expansion in moist fibers, restoring the raw airflow value to its equivalent reading under standard testing conditions.
Algorithms for Regain and Pressure Offset Compensation
Modern HVI systems run multi-variable linear and polynomial regressions to refine raw differential pressure signals. The core correction model follows the structural equation:
Mic_corr = Mic_raw + alpha x (R_std – R_act) + beta x (P_std – P_act) + gamma x (T_lab – T_std)
Where Mic_raw is the unadjusted instrument output, R_act is measured moisture regain percentage, R_std is the 7.0 percent reference regain, P_act is ambient barometric pressure inside the chamber, P_std is the 101.3 kPa reference pressure, T_lab is measured lab temperature, and T_std is the 21.0 °C reference temperature. Coefficients alpha, beta, and gamma derive from empirical calibration against International Calibration Cottons across different micronaire ranges.
- Thermal Compensation Coefficient scales raw pressure shifts against ambient air density changes, stabilizing transducer baseline voltage across multi-shift lab operations.
- Regain Slope Adjustment Factor corrects for cellulosic swelling dynamics in high humidity, preventing false low-micronaire readings.
- Barometric Linearization Term compensates for laboratory elevation differences, standardizing values between coastal port labs and inland mills.
- Instrument Drift Offset recalculates daily baseline adjustments from check-cotton calibration runs executed every 100 samples.

Worked Model of Micronaire Adjustment for High-Count Ring Spinning
To see the operational and financial impact of uncorrected micronaire data, consider a high-speed ring mill processing an incoming lot of Upland cotton for Ne 40 combed yarn. The laboratory tests a 10.00-gram sample under non-standard conditions: temperature at 24.5 °C, relative humidity at 74 percent, and sample moisture regain at 8.4 percent because of insufficient conditioning time.
The raw HVI transducer returns a pressure drop corresponding to an uncorrected micronaire (Mic_raw) of 3.55. Evaluated on raw data alone, the mill classer would mark this lot as fine fiber with potential maturity risks, lowering spindle speeds or reassigning the cotton to lower count blends to avoid thread breaks.
Using empirical calibration parameters where alpha = 0.125, beta = 0.008, and gamma = 0.015, the environmental adjustments calculate as follows:
Regain Delta = 7.0 – 8.4 = -1.4 percent
Temperature Delta = 24.5 – 21.0 = +3.5 °C
Applying these values to the compensation model:
Mic_corr = 3.55 + (0.125 x -1.4) + (0.015 x 3.5) = 3.55 – 0.175 + 0.0525 = 3.427
However, atmospheric barometric pressure at the inland mill site reads 97.2 kPa compared to the standard 101.3 kPa baseline:
Pressure Delta = 101.3 – 97.2 = +4.1 kPa
Mic_final = 3.427 + (0.008 x 4.1) = 3.46
The corrected micronaire value settles at 3.46 compared to the raw reading of 3.55. This 0.09-unit shift changes the projected fiber count per yarn cross-section during Ne 40 spinning:
Uncorrected Calculated Ends (Mic 3.55): N = (590.5 / 40) / (3.55 x 0.394) = 14.76 / 1.398 = 10.56 tex yarn / 0.1398 tex fiber = 75.5 fibers
Corrected Calculated Ends (Mic 3.46): N = (590.5 / 40) / (3.46 x 0.394) = 14.76 / 1.363 = 10.56 tex yarn / 0.1363 tex fiber = 77.4 fibers
The corrected calculation adds two fibers to the yarn cross-section. That small difference provides enough structural cohesion to run Ne 40 yarn at 19,500 RPM without excessive end-downs. Without mathematical correction, the mill would miscalculate drafting resistance, set apron nips incorrectly, and impose unnecessary speed limits across the spinning room.
How Does Instrument Temperature Calibration Prevent Systematic Drift?
Thermal stability in the internal pressure sensors prevents calibration slope decay during high-volume testing runs. Transducer diaphragms expand slightly when ambient room temperature fluctuates by more than 2.0 °C per hour. Automated check routines run reference calibration samples through the chamber every two hours to track zero-point stability.
If a reference reading drifts by more than ± 0.05 micronaire units, the software halts testing and prompts the technician for a full multi-point calibration against International Calibration Cottons.
| Quality Parameter | Raw Data Basis (Mic 3.55) | Corrected Data Basis (Mic 3.46) | Variance / Variance Delta |
|---|---|---|---|
| Predicted Yarn Tenacity (cN/tex) | 15.8 | 16.4 | + 0.6 cN/tex (+ 3.8%) |
| Yarn Unevenness (U%) | 11.2 | 10.7 | – 0.5 U% (Improved regularity) |
| Imperfection Index (IPI per km) | 185 | 142 | – 43 IPI (- 23.2%) |
| Spindle End-Down Rate (per 1000 sh) | 28 | 16 | – 12 Breaks (- 42.8%) |
Applying real-time temperature and regain corrections lowers yarn mass CV percentages by 0.4 points across fine-count ring production lots.
Raw instrument readings obtained without concurrent regain compensation generate misleading fiber end counts, distorting predictive yarn tenacity equations.
Calibrate instruments daily against international standards and apply real-time regain corrections before establishing final bale laydown categories.

Bale
Bale room operations mark the first physical step in integrating raw cotton into the spinning process. A typical ring spinning laydown combines cotton from 30 to 120 bales arranged along parallel automatic plucking lines. The main goal in bale management is keeping average micronaire stable while holding within-laydown standard deviation below 0.15 units.
Sudden shifts in laydown micronaire alter drafting forces, leading to yarn count variations, dye streaks, and fabric barré in downstream knits or wovens.
Automatic bale openers pluck fiber tufts from each bale in sequence. If a laydown includes uncategorized bales ranging from 3.2 to 4.8 micronaire without deliberate placement, high-density tufts from coarse bales mix unevenly with low-density tufts from fine bales. This causes localized variations in drafting resistance at the ring frame and spikes periodic yarn count CV.
- Bale Lot Receipt and HVI Sampling takes physical samples from 100 percent of incoming bales, sampling both sides of each bale to evaluate lot homogeneity.
- Data Correction and Normalization runs raw HVI metrics through temperature, regain, and barometric algorithms to produce true baseline micronaire values.
- Categorical Grouping and Range Distribution sorts bales into micronaire categories in narrow 0.10-unit increments (for example, Category 1: 3.80-3.89, Category 2: 3.90-3.99).
- Laydown Formula Construction draws an identical proportion of bales from each category for every daily laydown, holding target mean micronaire within ± 0.03 units.
- Blowroom Mechanical Blending sends plucked tufts through multi-chamber blenders and continuous mixers to homogenize physical properties before carding.
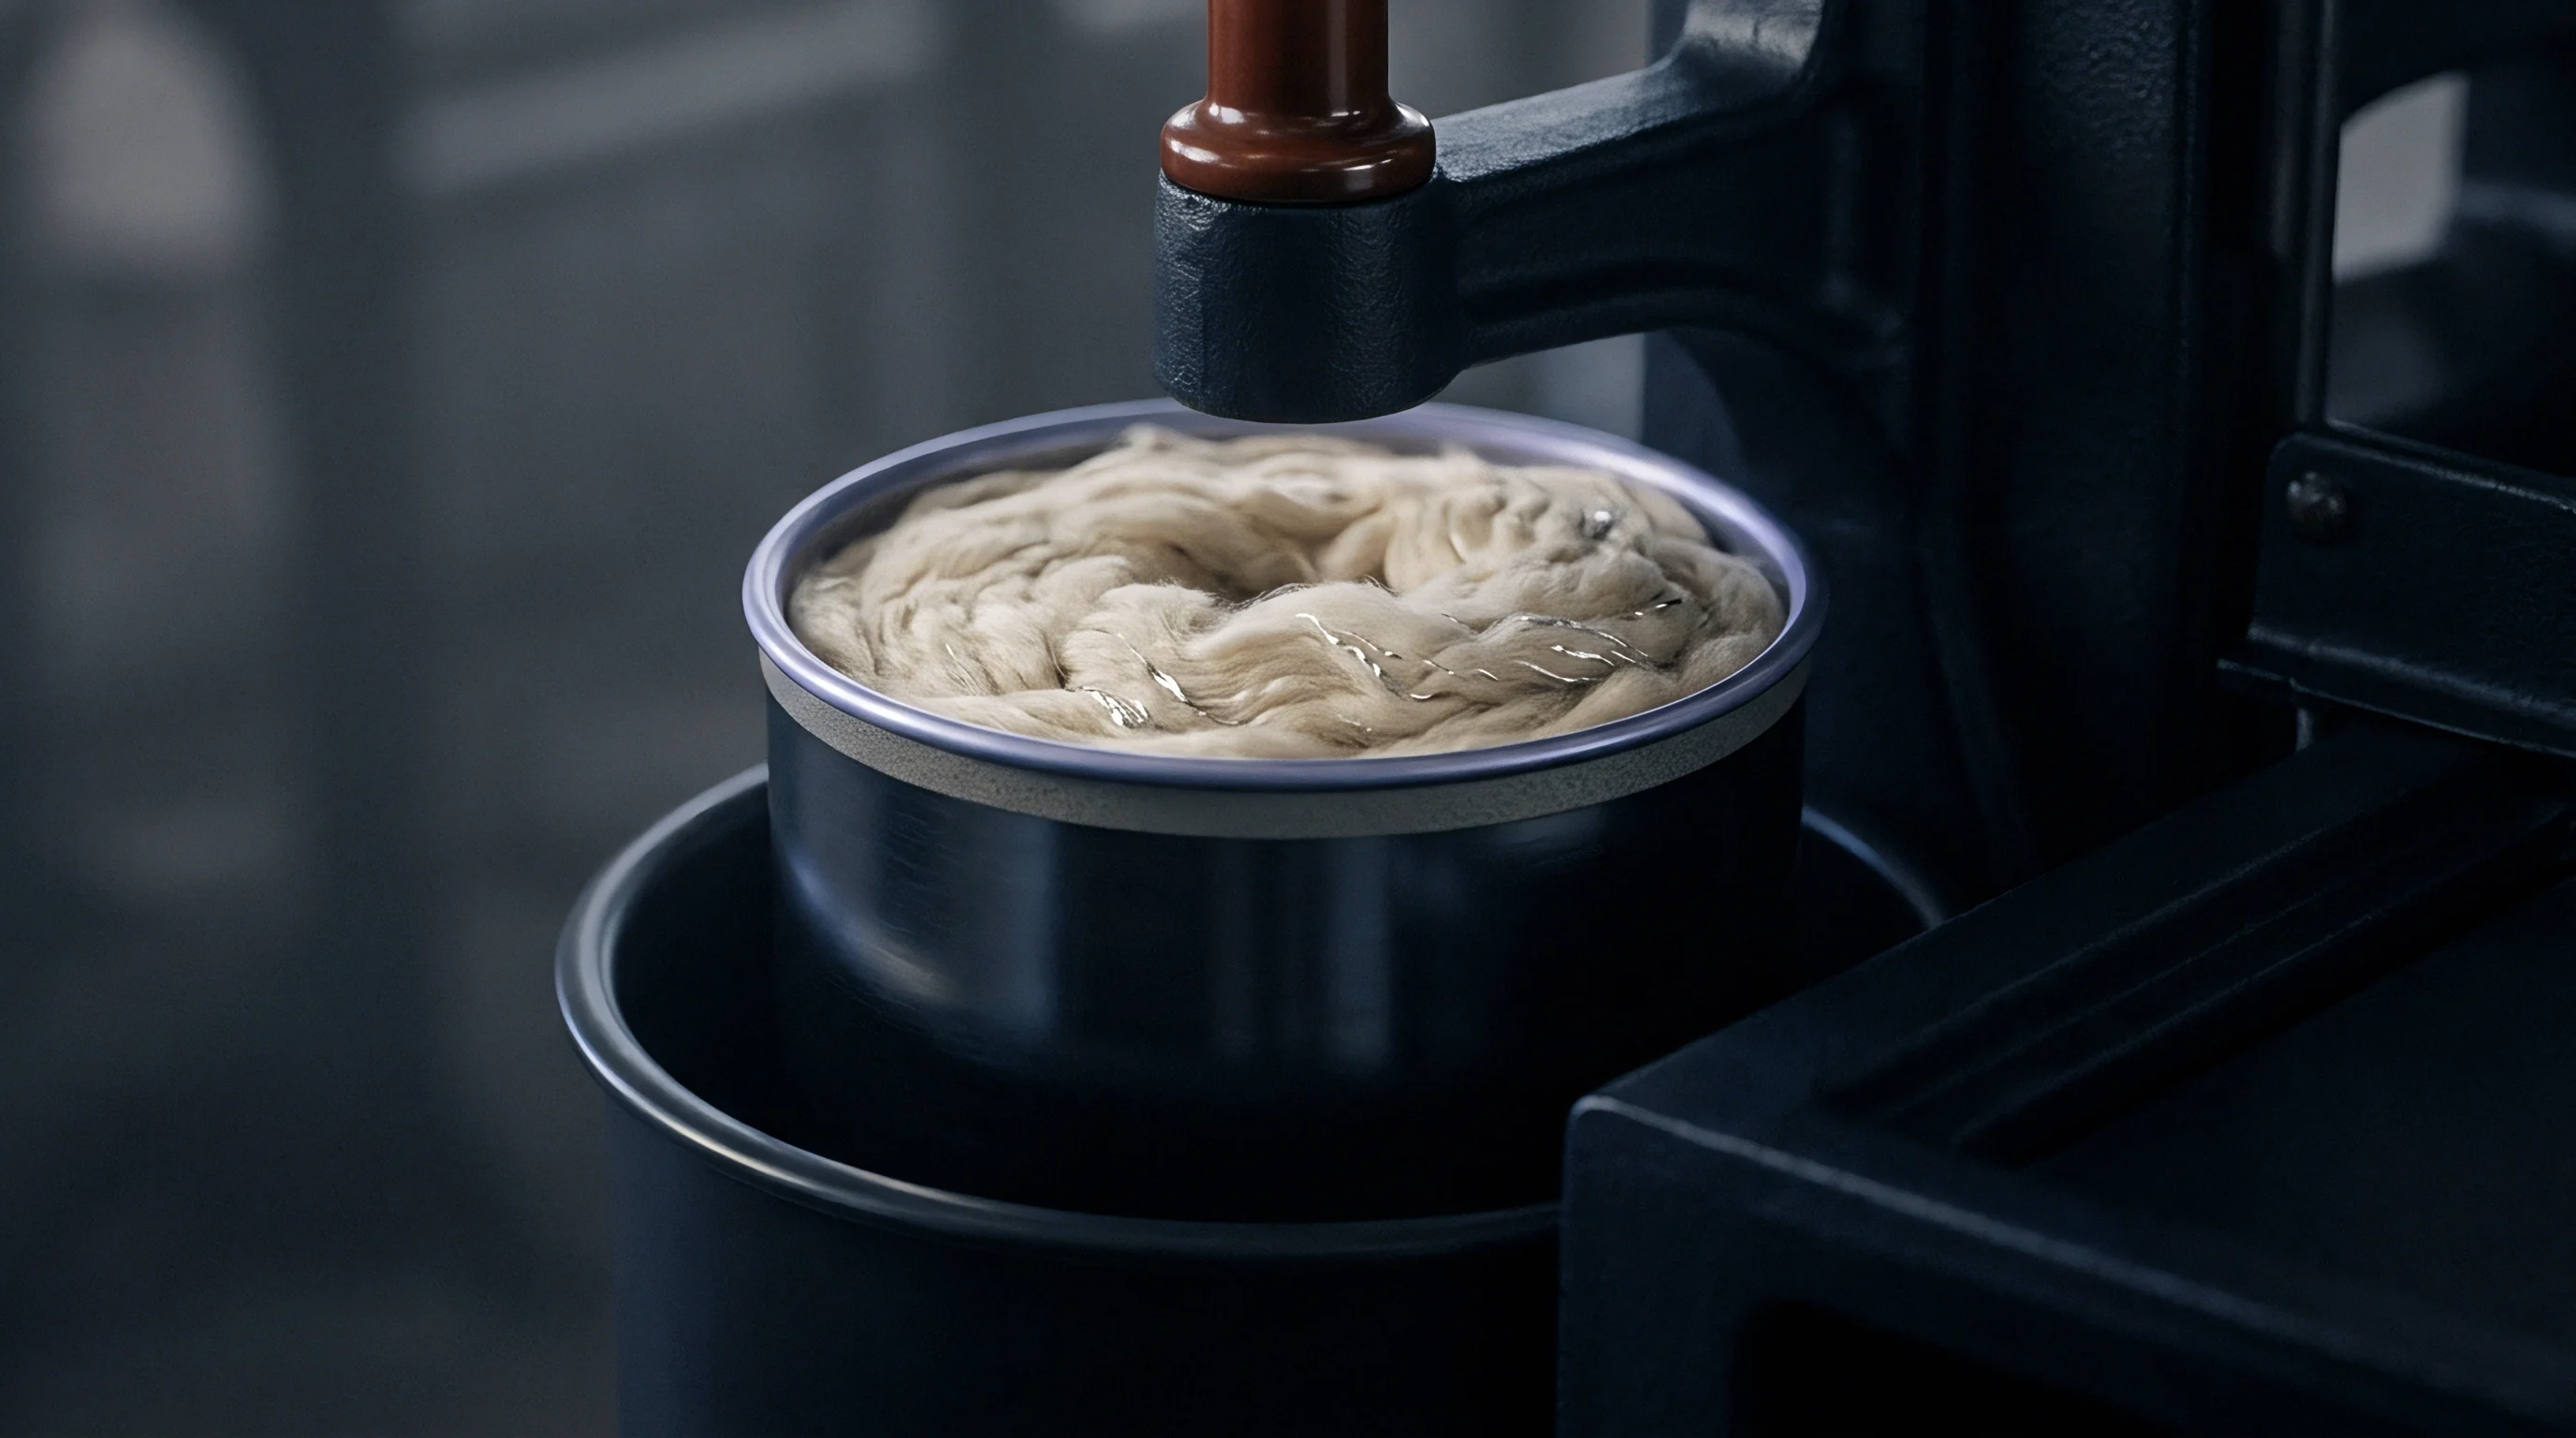
Bale Management Systems and Range Categorization
Modern mills use software-driven bale management systems (BMS) to organize raw inventory. The software indexes incoming bales by corrected micronaire, staple length, strength, and color grade. When building a laydown for high-speed ring spinning, it calculates a balanced distribution curve around the mill’s target value (for instance, 4.10 micronaire for Ne 40 combed yarn).
| Category Code | Micronaire Range | Target Proportion (%) | Bale Count in 60-Bale Laydown |
|---|---|---|---|
| MIC-A | 3.70 – 3.89 | 15 % | 9 Bales |
| MIC-B | 3.90 – 4.09 | 35 % | 21 Bales |
| MIC-C | 4.10 – 4.29 | 35 % | 21 Bales |
| MIC-D | 4.30 – 4.49 | 15 % | 9 Bales |
Controlling the share of extreme categories (MIC-A and MIC-D) prevents fiber clustering during plucking. Placing high-micronaire bales next to low-micronaire bales along the opener track forces physical pre-mixing right at mechanical extraction.

Blowroom Blending and Intra-Lot Variance Control
Mechanical openers feed tufts into multi-chamber blending reserves. Advanced blowroom lines pass fiber streams through six- or eight-chamber continuous blenders, where air currents stack tufts horizontally and extract them vertically. This 90-degree cross-lamination smoothes out bale-to-bale variation, ensuring the fiber web exiting the carding machine maintains uniform linear density and consistent average micronaire.
When intra-lot variance runs too high, carding machines produce sliver with fluctuating short-fiber content and unpredictable nep formation. Even fine-tuned carding flats cannot remove neps effectively when high concentrations of immature fibers hit the clothing wires in bursts. Consistent laydown execution stabilizes carding efficiency and protects downstream drawframe drafting.
Contractual specifications under International Cotton Association Bylaws establish strict price discount rules when lot average micronaire deviates beyond agreed contractual bands.

Arbitration
Commercial raw cotton contracts rely on standardized quality parameters established by bodies like the International Cotton Association (ICA) or the American Cotton Shippers Association (ACSA). Sales agreements specify narrow target bands for micronaire ~ typically 3.5 to 4.9 for base-grade Upland cotton. Deviations outside the agreed range trigger price adjustments, commercial claims, or rejection of the shipment.
When international shipments arrive at destination ports, mill labs re-test incoming lots on calibrated HVI equipment. If destination reports disagree with origin classing certificates, formal dispute resolution begins. Re-testing requires mutually agreed sampling protocols, standardized specimen conditioning, and testing at certified independent arbitration laboratories.
Contract Specifications and Quality Discount Schedules
Raw cotton contracts spell out explicit price adjustments tied to micronaire bands. Values from 3.8 to 4.2 command premium pricing because of their optimal performance in high-speed ring spinning. Ranges of 3.5 to 3.7 or 4.3 to 4.9 face minor discounts (base scale), while readings below 3.4 (immature fiber risk) or above 5.0 (coarse fiber penalty) carry heavy financial penalties or give buyers the right to reject the lot outright.
| Micronaire Range | Classification Designation | Commercial Value Allowance / Penalty | Operational Risk Level |
|---|---|---|---|
| 4.3 – 4.9 | G5 Range (High Coarse) | Discount 1.50 to 3.00 US cents/lb | High yarn hairiness, low strength. |
| 3.8 – 4.2 | Premium Range | Premium + 1.50 US cents/lb | Optimal high-speed ring spinning. |
| 3.5 – 3.7 | Base Range | Par (No Adjustment) | Standard medium count spinning. |
| 3.0 – 3.4 | G3 Range (Low Immature) | Discount 3.00 to 6.00 US cents/lb | Severe nep generation, dye streaks. |
| Below 3.0 | Sub-standard / Rejectable | Buyer Option to Reject or Re-price | Unsuitable for fine count yarns. |
Faulty instrument calibration at origin labs leads to misclassified bales being shipped to high-speed mills. If a 1000-bale lot reads an uncorrected 3.8 at origin but tests at 3.4 upon arrival, the financial impact is immediate. The buyer can claim commercial allowances exceeding 30,000 USD on a single shipment while suffering severe disruption on the spinning floor.

Commercial Exposure in Cross-Border Yarn Delivery
Disputes that reach formal arbitration require meticulous documentation. Standard ICA rules specify that quality appeals must sample ten percent of the disputed lot with an authorized representative present. Samples travel in sealed, vapor-tight containers to designated testing authorities, where labs run tests using certified standards under strict ASTM D1776 conditions.
Applying proper mathematical corrections to HVI data bridges the operational gap between raw material purchasing and high-speed spinning performance. Modern mills protect their yarn margins by incorporating standardized regain compensation algorithms directly into receiving inspection routines, validating every bale before it hits the laydown line.