Standard Core Sampling Methods for Raw Cotton Bale Testing
Standard core sampling extracts representative full-depth fibers across compressed bales to verify moisture, micronaire, and net scoured commercial mass.


Probe
Extracting representative fiber plugs from raw cotton bales requires driving a rotating hollow cutter into tightly packed lint with pneumatic pressure. Standard commercial Upland and Pima bales leave the gin press at densities between 450 kilograms per cubic meter and 500 kilograms per cubic meter. Penetrating material this dense without disturbing natural fiber alignment or generating excessive frictional heat depends on refined tube geometry and controlled feed rates.
Traditional hand sampling reaches only 50 to 100 millimeters into the outer shell near the tie seams, exposing samples to air, surface dirt, and severe spatial bias. Core sampling eliminates these errors by pulling continuous cylindrical cross-sections directly from the interior.
A properly set cutter shears through the compressed lint cleanly.
The tool assembly consists of a seamless stainless steel or hardened alloy tube tipped with a specialized cutting head. Internal bore diameters range from 12.7 millimeters to 25.4 millimeters, with 19.0 millimeters serving as the standard for High Volume Instrument testing. The tip uses either micro-serrated tungsten carbide teeth or a smooth, double-beveled edge.
Double-beveled tips shear cleanly across compressed lint without wrapping fibers around the cutter nose, whereas serrated teeth cut into universal density bales where tight fiber interlocking stops smooth blades. Behind the cutting edge, the internal bore tapers outward by 1.5 to 2.0 degrees. This relief reduces lateral drag as the cotton plug moves up the barrel, preserving sample integrity.
Mechanical Architecture of Rotating Hollow Cutters
Coring rigs rely on electromechanical or high-torque pneumatic motors running from 400 revolutions per minute to 1200 revolutions per minute. Rotational speed must be balanced against linear thrust: spinning fast while advancing slowly generates localized heat at the cutting edge. Above 60 degrees Celsius, natural surface waxes begin to soften ~ their full melting range spans 65 degrees Celsius to 85 degrees Celsius.
Softened wax accumulates on the cutter tip, catching fine trash and scorching fiber ends. These heat-damaged fibers read artificially weak during HVI strength testing and inflate short fiber index values due to thermal embrittlement. Advancing the probe with linear thrust cylinders at 50 millimeters per second to 100 millimeters per second maintains a clean shear and keeps localized heating under control.
Pneumatic drive systems deliver the constant force needed to advance the blade.
Air-assisted extraction systems inject compressed air at 5.5 bar to 6.2 bar through an annular venturi ring set in the rear housing. This generates a vacuum that draws the cut plug into a clear collection canister, removing the need for mechanical push-rods. Rods tend to compress core samples, altering fiber orientation and matting leaf trash into dense clumps.
Vacuum extraction preserves the structural layers of the plug, making internal moisture pockets and ginning defects easier to identify.
Friction Thermodynamics at High Compression Density
A compressed bale absorbs substantial energy during sampling, converting rotational friction directly into heat. With lint carrying a low thermal conductivity of roughly 0.04 Watts per meter-Kelvin, heat generated at the cutting edge dissipates slowly, building a hot zone along the wall of the sample. Should the cutter dwell in place for more than two seconds without advancing, temperatures can exceed 100 degrees Celsius, driving bound moisture out of the plug.
That loss artificially reduces measured regain figures and skews commercial weight calculations.
Maintaining sharp cutting edges prevents artificial distortion of fiber length.
Blade sharpness directly affects sample quality. A dull cutter displaces fiber into the barrel rather than shearing through it, stretching and snapping strands before they reach testing. This breakage can reduce measured Upper Half Mean Length by up to 0.8 millimeters while increasing the Short Fiber Index by 2.5 percentage points.
Maintenance protocols call for checking the cutting edge radius every 500 extractions using optical comparators, replacing heads once edge radius exceeds 15 micrometers.

Pneumatic Penetration Vectors and Tube Geometry
The entry angle relative to the bale ties determines how well the sample represents the entire bale. Gin presses pack cotton in flat layers perpendicular to the ram. Driving the probe straight through these layers captures a complete cross-section of all tramper passes.
Driving parallel to the layers extracts fiber from a single stratum, undermining the purpose of coring. Standard procedures specify entering through the rounded heads or flat sides to cross every compressed layer at a 90-degree angle.
| Probe Bore Diameter (mm) | Optimal Rotational Speed (rpm) | Linear Penetration Rate (mm/s) | Friction Heat Rise (°C) | Average Core Plug Yield (g/m) |
|---|---|---|---|---|
| 12.7 | 1100 | 85 | +18.4 | 14.2 |
| 19.0 | 750 | 65 | +11.2 | 31.8 |
| 25.4 | 450 | 45 | +6.5 | 58.4 |
Tension bands exert heavy lateral pressure inside compressed bales. Steel or high-tenacity polyester straps can create internal forces reaching 3.5 Megapascals. Driving a probe within 50 millimeters of a band risks pinching the cutter tube or snapping the strap, which can burst the outer bale structure.
Automated sampling rigs use optical sensors to map band positions and center the probe between them, avoiding binding, protecting drive motors, and keeping the bale intact.
Incorrect probe diameters or uncalibrated motor speeds degrade sample structure and break fibers, generating inaccurate short-fiber index values that can trigger costly mill rejections.


Strata
Raw cotton bales are seldom uniform. Gins process seed cotton in batches, feeding variable field loads through cleaning equipment before pressing. As the tramper builds the bale, distinct horizontal strata form, each reflecting the moisture, staple length, and trash content of the specific module section harvested.
At the same time, outer layers interact with ambient warehouse air, creating steep moisture gradients between the shell and the interior.
Internal density changes noticeably from the surface to the center.
Moisture migrates through cotton along vapor pressure gradients. While the outer shell absorbs or loses moisture rapidly as ambient humidity changes, the dense core ~ insulated by compressed outer fiber ~ can retain its moisture level for months. A bale stored at 35 percent relative humidity forms a dry outer layer while preserving higher moisture inside.
Sampling only surface lint underestimates overall lot moisture, introducing systematic errors into scoured net weight calculations.
What Core Depth Strategy Neutralizes Moisture Stratification in Bales?
Driving the probe through the full depth of the bale averages out variation across internal layers. Advancing the cutter entirely through ~ from head to head or side to side ~ extracts fiber from every stratum. Penetrating only 200 millimeters into a 550-millimeter-wide bale captures the outer shell while missing core conditions.
Full-depth sampling ensures that moist interior zones and drier surface layers are proportionally represented in the final sample.
Moisture content drops by up to 2.4 percentage points between the outer 50 millimeters of a bale shell and its inner core under ambient storage below 45 percent relative humidity.
Fluctuations in moisture directly alter calculated scoured yield.
Compression dynamics concentrate trash along distinct internal boundaries. Heavy particles, such as seed coat fragments and small leaf pieces, settle during pneumatic transit into the press box, where the tramper flattens them into thin sheets. Coring directly across these planes captures an accurate cross-section of trash mass, whereas surface sampling misses internal trash layers entirely.
- Bale Alignment position the target bale on the sampling deck with bands oriented horizontally and flat surfaces exposed to the pneumatic drive axis.
- Probe Calibration inspect the tungsten carbide cutter edge for burrs, verify internal barrel cleanliness, and set the linear travel limiter to 95 percent of full bale depth.
- Drive Engagement initiate probe rotation at 750 revolutions per minute before firing the pneumatic thrust cylinder to ensure clean initial surface shear.
- Penetration Execution advance the rotating tube through the complete bale axis at a uniform linear speed, maintaining continuous positive pressure to prevent localized overheating.
- Plug Extraction activate the pneumatic venturi system at the end of the stroke to draw the severed core sample into the sealed specimen chamber without mechanical compression.
- Atmospheric Sealing transfer the extracted fiber plug immediately into a heavy-duty vapor-impermeable barrier bag and expel excess air before hermetic sealing.

Density Gradient Dynamics across Pressed Layers
Internal mass density in a universal density bale varies from roughly 380 kilograms per cubic meter near the outer crowns to over 520 kilograms per cubic meter at the center. Wall friction inside the press box restricts fiber movement during compression, creating this gradient. Higher central density packs fibers tightly, trapping micro-dust and fine trash within dense clusters.
Bale ties maintain substantial lateral compression across the outer shell.
Coring tools encounter these dense central zones under heavy axial loads. Once severed, the compressed plug expands inside the tube. If internal wall friction is excessive, the expanding lint jams and compresses rather than shearing cleanly.
Polished stainless steel interiors with a surface roughness below 0.4 micrometers Ra allow plugs to slide smoothly into the collection chamber.

Spatial Trash Segregation in Ginning Batches
Trash distribution in raw bales reflects the operating patterns of ginning machinery. Pre-cleaners, saw gins, and lint cleaners remove coarse debris, but high-speed processing shatters seed coats and motes into fine particles. These fragments move through lint ducting in pulses, creating narrow bands of heavy contamination within individual bales.
Cooler storage conditions slow the rate of moisture loss across the bale.
Small surface samples risk striking an unusually clean zone or an isolated trash pocket, distorting the evaluation. Coring extracts material through the full depth profile, blending variable trash layers into a representative composite. High Volume Instruments then measure trash percentage, area counts, and dust levels from this blended sample to produce data that reflects actual mill performance.
Full-depth penetration across all compressed layers yields reliable analytical data, whereas shallow surface sampling primarily captures ambient moisture and external contamination.

Variance
Testing every bale in a commercial lot provides complete quality mapping, but commercial trading generally relies on statistical sampling. Establishing sample sizes that maintain statistical confidence requires understanding how individual fiber properties vary. Micronaire, staple length, fiber strength, and trash area each exhibit different standard deviations across a gin lot, so sampling frequency must scale to match the property being evaluated.
Fiber breakage during sampling skews instrument length readings.
Micronaire variation within a single uniform farm lot typically follows a normal distribution, with standard deviations between 0.12 and 0.18 mic units across 100 bales. In mixed lots or modules harvested across varying soils, that standard deviation widens to 0.35 mic units. Drawing too few samples when variance is high risks misclassifying the lot and incurring price penalties at delivery.
Statistical Confidence Boundaries in High Volume Testing
Calculating required core sampling intensity relies on finite population sampling statistics. Standard error of the mean depends on population standard deviation, sample size, and total lot size. Incorporating the finite population correction factor, the equation for standard error is:
SE = (s / sqrt(n)) sqrt((N – n) / (N – 1))
Where SE is standard error, s is sample standard deviation, n is the number of cored bales, and N is total lot size. Increasing sampling intensity from 10 percent to 100 percent narrows the confidence interval and sharpens lot characterization.
Under USDA classing standards, a lot sampled at less than 100 percent core intensity forfeits official individual bale identification status and defaults to lot-average statistical valuation.
Static charges cause fine trash particles to adhere to fiber surfaces.
Staple length remains far more consistent than trash content across a ginning run. Upper Half Mean Length standard deviations within a single-origin lot rarely exceed 0.45 millimeters, allowing smaller sample sizes to estimate mean staple length accurately. Trash area percentage varies much more widely, often exceeding a 25 percent coefficient of variation due to uneven leaf contamination.
Obtaining an accurate trash measurement requires higher sampling rates or larger composite core masses.
Sample Size Mathematics for Commercial Lot Acceptance
Determining sample size for a specified confidence limit relies on the standard normal z-score formula. For a 95 percent confidence level (z = 1.96) and a target allowable error E, the required sample size n is:
n = (N z^2 s^2) / (E^2 (N – 1) + z^2 s^2)
Evaluating a 200-bale lot with a micronaire standard deviation of 0.25 mic units and an allowable error target of 0.05 mic units illustrates the impact of sample size. Applying these values yields a minimum sample requirement of 63 bales. Coring only 20 bales (10 percent) doubles the margin of error to 0.10 mic units, exposing the buyer to unhedged quality variations.
| Sampling Intensity (%) | Bales Cored (n) | Micronaire Error Margin (± mic) | Length Error Margin (± mm) | Strength Error Margin (± g/tex) |
|---|---|---|---|---|
| 10 | 20 | 0.104 | 0.192 | 0.85 |
| 20 | 40 | 0.070 | 0.129 | 0.57 |
| 50 | 100 | 0.035 | 0.065 | 0.29 |
| 100 | 200 | 0.000 | 0.000 | 0.00 |
Extracting specimens from core plugs requires pulling fibers without bias. HVI units use automated pneumatic combs to extract test beards from opened plugs. If dull coring tools have left tangled or matted lint inside the plug, the comb selectively catches short or broken fibers.
That mechanical artifact depresses the measured Uniformity Index and inflates the Short Fiber Index, triggering unwarranted price discounts.
Worked Calculation of Micronaire and Length Sampling Error
Consider a 500-bale shipment of Upland cotton sold against a base micronaire target of 4.20, with a contract penalty of 2.0 cents per pound if the lot average falls below 4.00 or rises above 4.90. The supplier cores 50 bales (a 10 percent rate), and the laboratory reports a mean of 4.04 mic units with a standard deviation of 0.28 mic units.
Laboratories reject unconditioned specimens prior to official testing.
Calculating the 95 percent confidence interval for the true lot mean using the finite population standard error equation:
SE = (0.28 / sqrt(50)) sqrt((500 – 50) / (500 – 1))
SE = (0.28 / 7.071) sqrt(450 / 499)
SE = 0.0396 0.9498 = 0.0376 mic units
At 95 percent confidence (z = 1.96), the margin of error equals 1.96 x 0.0376 = 0.0737 mic units, placing the true population mean between 3.966 and 4.114 mic units. Because the lower bound (3.97) falls below the 4.00 penalty threshold, a 10 percent sample fails to establish that the lot is penalty-free. Increasing sampling to 250 bales (50 percent intensity) reduces standard error to 0.0123 mic units and margin of error to 0.024 mic units, narrowing the mean range to 4.016 ~ 4.064 mic units.
This higher sampling rate eliminates financial uncertainty and confirms contract compliance.
While a sample average landing inside the target range appears to indicate compliance, sampling variance can leave that average statistically unreliable.


Discrepancy
Extracting a core plug is only the first step in fiber testing. Moving samples from bale storage into laboratory environments exposes them to changing air and handling conditions. Raw cotton continually gains or loses moisture based on ambient temperature and humidity.
If core samples are not stabilized under standard lab conditions, systematic measurement errors distort physical HVI metrics.
Changes in moisture regain directly alter calculated dry mass.
Standard testing environments follow ASTM D1776 guidelines, maintaining temperatures at 21 ± 1 degree Celsius and relative humidity at 65 ± 2 percent. Cores drawn from warm, humid warehouses carry elevated moisture; testing damp samples directly on HVI equipment inflates strength readings and depresses micronaire values. Swollen fibers change airflow resistance during micronaire measurement, while added moisture increases hydrogen bonding within crystalline cellulose, artificially boosting bundle tenacity values by up to 2.5 grams per tex.

Standard Atmospheric Equilibrium for Core Plug Conditioning
Conditioning procedures bring core samples to moisture equilibrium prior to testing. High-moisture samples undergo pre-conditioning in dry air maintained at 10 to 25 percent relative humidity and below 50 degrees Celsius for at least 4 hours. This removes surface water, allowing fibers to approach final equilibrium from the dry side.
Final conditioning requires 24 hours on open wire mesh trays in standard lab air, or 45 minutes in rapid forced-air units.
Electrostatic charges cause fine leaf particles to stick to fibers.
Technicians track conditioning by weighing sample plugs every 30 minutes. Equilibrium is reached when consecutive weighings differ by less than 0.1 percent in mass. Testing unconditioned samples skews HVI calibration baselines and produces erroneous figures that complicate trade settlements.

Laboratory Specimen Preparation and Trash Segregation
Core samples arrive at the laboratory as dense plugs that must be gently opened to separate layers without snapping individual strands. Technicians open plugs manually or pass them through low-speed specimen openers designed for cored cotton.
A calibrated draw bar ensures smooth specimen preparation.
Aggressive mechanical opening damages cotton fibers and skews length readings. Shirley analyzers use revolving saw-tooth cylinders to separate lint from heavy trash and micro-dust. Processing core samples with dull saw-teeth cuts long fibers and distorts length profiles.
Standard laboratory procedures require controlled feed rates, verified blade clearances, and calibrated airflow to separate trash without damaging fibers.
- Vapor Barrier Rupture punctured poly bags permit rapid moisture exchange during transit, altering core plug moisture regain before lab conditioning.
- Thermal Degraded Fiber excessive probe rotation speeds singe fiber tips, lowering HVI bundle tenacity and artificially elevating short fiber index.
- Mechanical Shear Fiber Fracture dull cutter bevels break fibers during core entry, shortening Upper Half Mean Length and depressing Uniformity Index.
- Over-Opening Specimen Damage aggressive laboratory opening tools break compressed core fibers, corrupting particle size counts on trash analyzers.
- Micro-Dust Loss unsealed specimen transport containers allow fine leaf particles to settle out, under-reporting trash area metrics.
HVI Comb Formation Dynamics from Core Plugs
High Volume Instruments extract test specimens from core plugs using automated combs. The comb penetrates the opened plug, grabs a fiber bundle, and draws it past an optical sensor. The uniformity of the specimen beard depends heavily on fiber orientation inside the plug.
Standard laboratory conditioning under ASTM D1776 requires core specimens to reach moisture equilibrium at 21 ± 1 °C and 65 ± 2 % RH before any physical HVI testing begins.
Pneumatic sample preparers use air jets to align fibers parallel to the comb’s travel path. If fibers remain tangled or matted, the comb snaps strands during extraction, artificially depressing the Uniformity Index. Thorough specimen opening relieves compression from coring and baling, enabling clean, undamaged beard sampling.
Standard commercial contracts include ASTM D1776 compliance clauses, rendering test certificates issued on unconditioned samples void in trade arbitration.


Settlement
Raw cotton commercial transactions settle on net commercial mass and core-sampled HVI properties. Final invoices adjust gross scale weights for packaging tare, moisture deviations, and quality premiums or discounts. Core sampling provides the empirical foundation for these financial adjustments, converting laboratory measurements into final contract values.
Calculating net scale weight requires subtracting all packaging material.
Determining commercial mass relies on oven-dry core weights combined with official moisture allowances. International standards (ISO 6741 and ASTM D2495) set official moisture regain for raw cotton at 8.5 percent. Gross bale weight includes lint, moisture, and packaging tare such as polywrap, bands, and wire clips.
Subtracting tare yields Net Scale Weight.

Commercial Mass Recalculation from Oven Dry Core Weight
Oven-dry core mass is determined by weighing a core specimen, drying it in a ventilated oven at 105 to 110 degrees Celsius until constant mass is reached, and recording the dry weight. The formula for Commercial Clean Mass is:
Commercial Mass = Net Dry Lint Mass (1 + (Official Regain / 100))
If a 100-bale lot shows a Net Scale Weight of 22,700 kilograms at a cored moisture content of 10.2 percent, actual dry lint mass is 20,384.2 kilograms. Applying the standard 8.5 percent moisture regain yields a Commercial Clean Mass of 22,116.9 kilograms. The buyer receives an invoice credit for 583.1 kilograms of excess water in the delivered bales.
Without core moisture testing, the buyer pays full lint price for unbonded water.
- Validate Core Sampling Protocol confirm that core extraction followed ASTM D1441 specifications using certified 19.0-millimeter hollow probes with full bale penetration.
- Verify Chain of Custody Seals cross-check specimen container security numbers against shipping manifests before laboratory acceptance.
- Audit Laboratory Conditioning Logs review temperature and relative humidity chamber recordings to ensure 24-hour compliance with ASTM D1776 tolerances.
- Inspect Oven-Dry Regain Calculations check dry mass stability data and verify that official 8.5 percent regain additions match net dry weight outputs.
- Reconcile HVI Parameter Schedules compare core-sampled micronaire, length, and strength figures against contract baseline specs and apply official price adjustments.
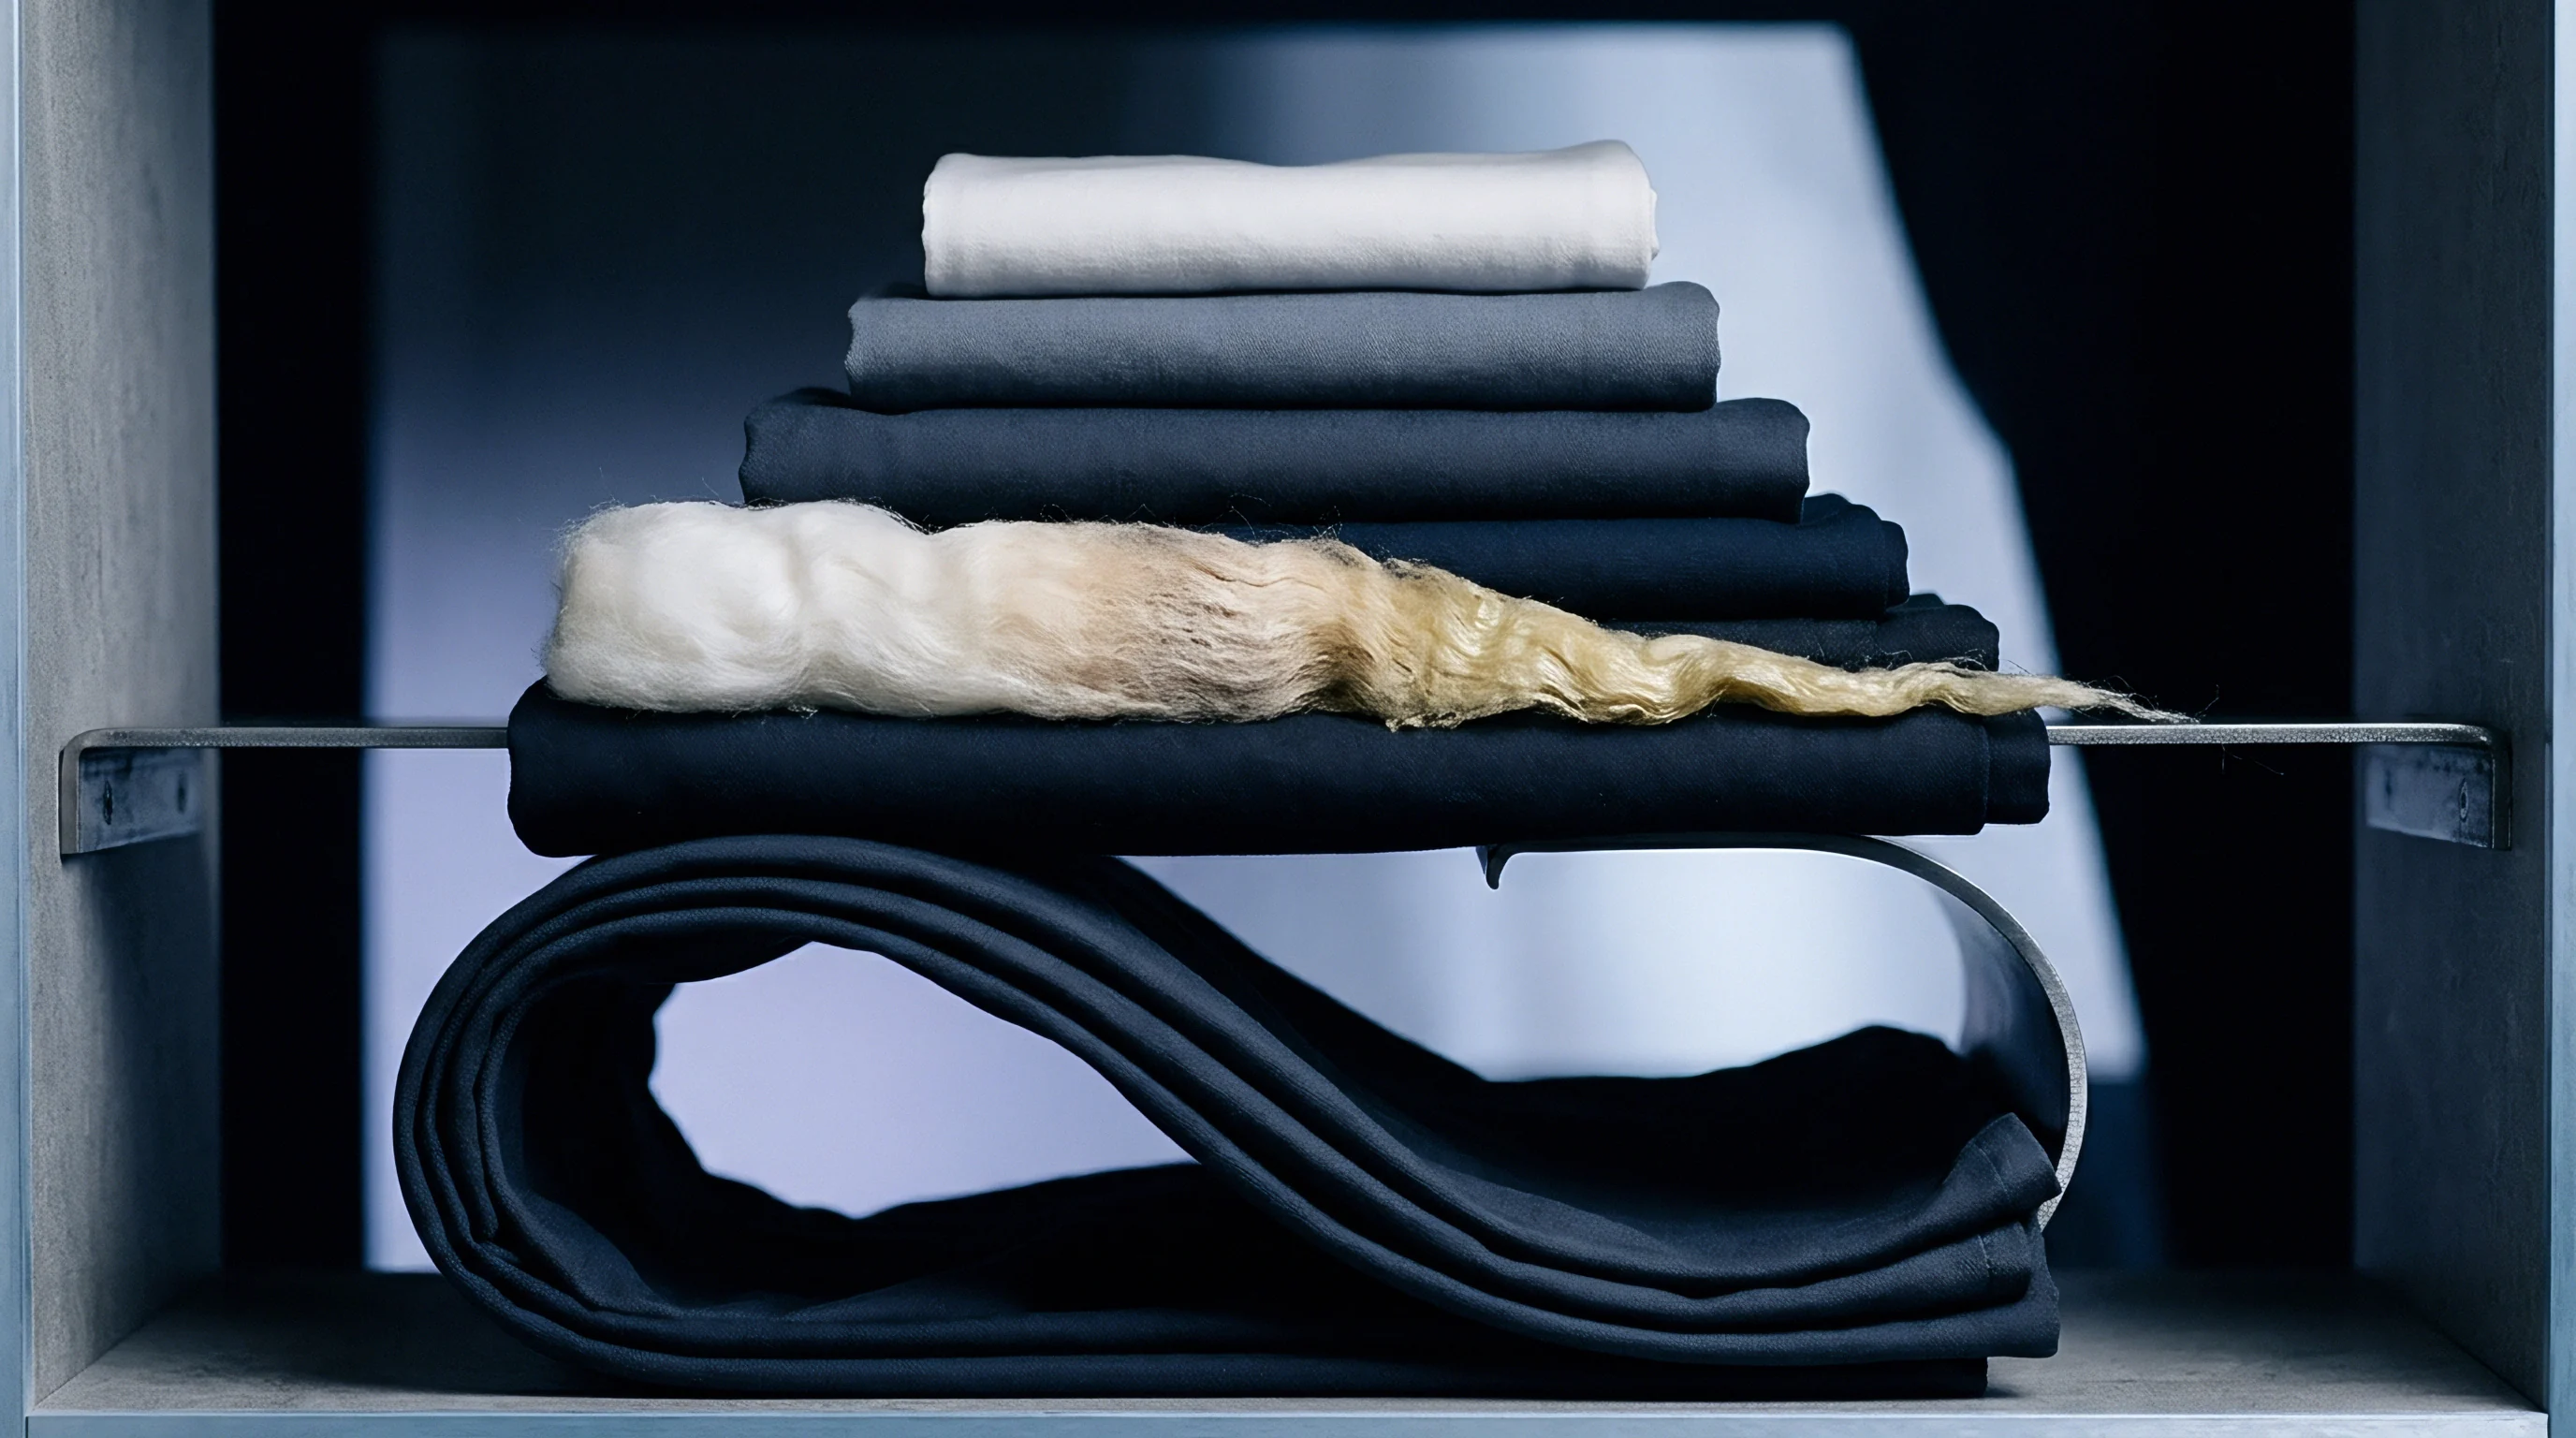
Micronaire Discount Schedules and Lot Valuation Penalties
Micronaire influences yarn spinning performance. Readings between 3.8 and 4.5 mic units fall within the base market range and receive full contract price. Values outside this band incur commercial penalties under trade rules established by organizations like the International Cotton Association (ICA).
Tare weight deductions directly modify final net weight calculations.
Core sampling identifies out-of-spec micronaire pockets within a lot. Low micronaire values (below 3.5 mic units) signal immature fibers prone to neps, uneven dye uptake, and yarn breaks. High values (above 4.9 mic units) indicate coarse fibers that reduce yarn strength.
Commercial discount schedules deduct specified cents per pound from base prices based on core-sampled HVI results.
| HVI Parameter | Contract Base Specification | Core Sample Measured Value | Commercial Price Adjustment |
|---|---|---|---|
| Micronaire (Fine) | 3.80 – 4.50 mic | 3.20 – 3.49 mic | -4.50 cents / lb |
| Micronaire (Coarse) | 3.80 – 4.50 mic | 5.00 – 5.29 mic | -3.00 cents / lb |
| Staple Length | 1.125 inches (36/32″) | 1.093 inches (35/32″) | -5.25 cents / lb |
| Bundle Strength | 29.0 g/tex | 26.5 g/tex | -3.50 cents / lb |
| Trash Area | 0.35 percent | 0.75 percent | -2.10 cents / lb |
Dispute resolution protocols require storing reserve core samples in sealed containers. If a buyer disputes laboratory test results, arbitration rules require testing reserve cores at an agreed independent facility. If reserve values fall within tolerance limits (±0.10 mic units for micronaire, ±0.38 mm for length), the original invoice stands.
Values falling outside tolerance trigger invoice adjustments based on the reserve testing average.

Dispute Resolution Frameworks for Commercial Core Testing
Arbitration through international cotton associations follows strict claim timelines. Buyer quality claims must be submitted within 42 days of vessel arrival at the destination port, supported by official core test certificates from accredited laboratories.
Core-sampled oven-dry testing removes commercial ambiguity by establishing net clean mass adjusted to the mandatory 8.5 percent international moisture regain standard.
Late claims or disputes based on unsealed hand samples are rejected automatically under trade rules. Secondary coring for arbitration must be conducted by certified classers using dual-probe rigs to prevent sampling bias. Financial settlements adjust against reserve sample results, binding both parties to the final laboratory report.
Bridging measurement gaps when destination core results differ from origin certificates within statistical tolerance limits requires clear contractual reconciliation clauses.


Dossier
Cross-border trade relies on verifiable records linking physical bales to core test reports. The testing dossier provides the legal and technical foundation for customs valuation, duty calculations, and payment release. Digital chain-of-custody tracking links core probe data directly with logistics networks, maintaining sample identity from warehouse deck to mill floor.
Customs auditors inspect core testing receipts during routine valuation reviews.
Chain of custody begins at extraction. Each sampled bale carries a permanent barcode tied to gin records. As the probe penetrates the bale, the rig scans the barcode and logs timestamp, operator ID, and insertion depth.
Sealed sample bags receive matching barcodes with encrypted signatures to prevent sample substitution or tampering during transit.
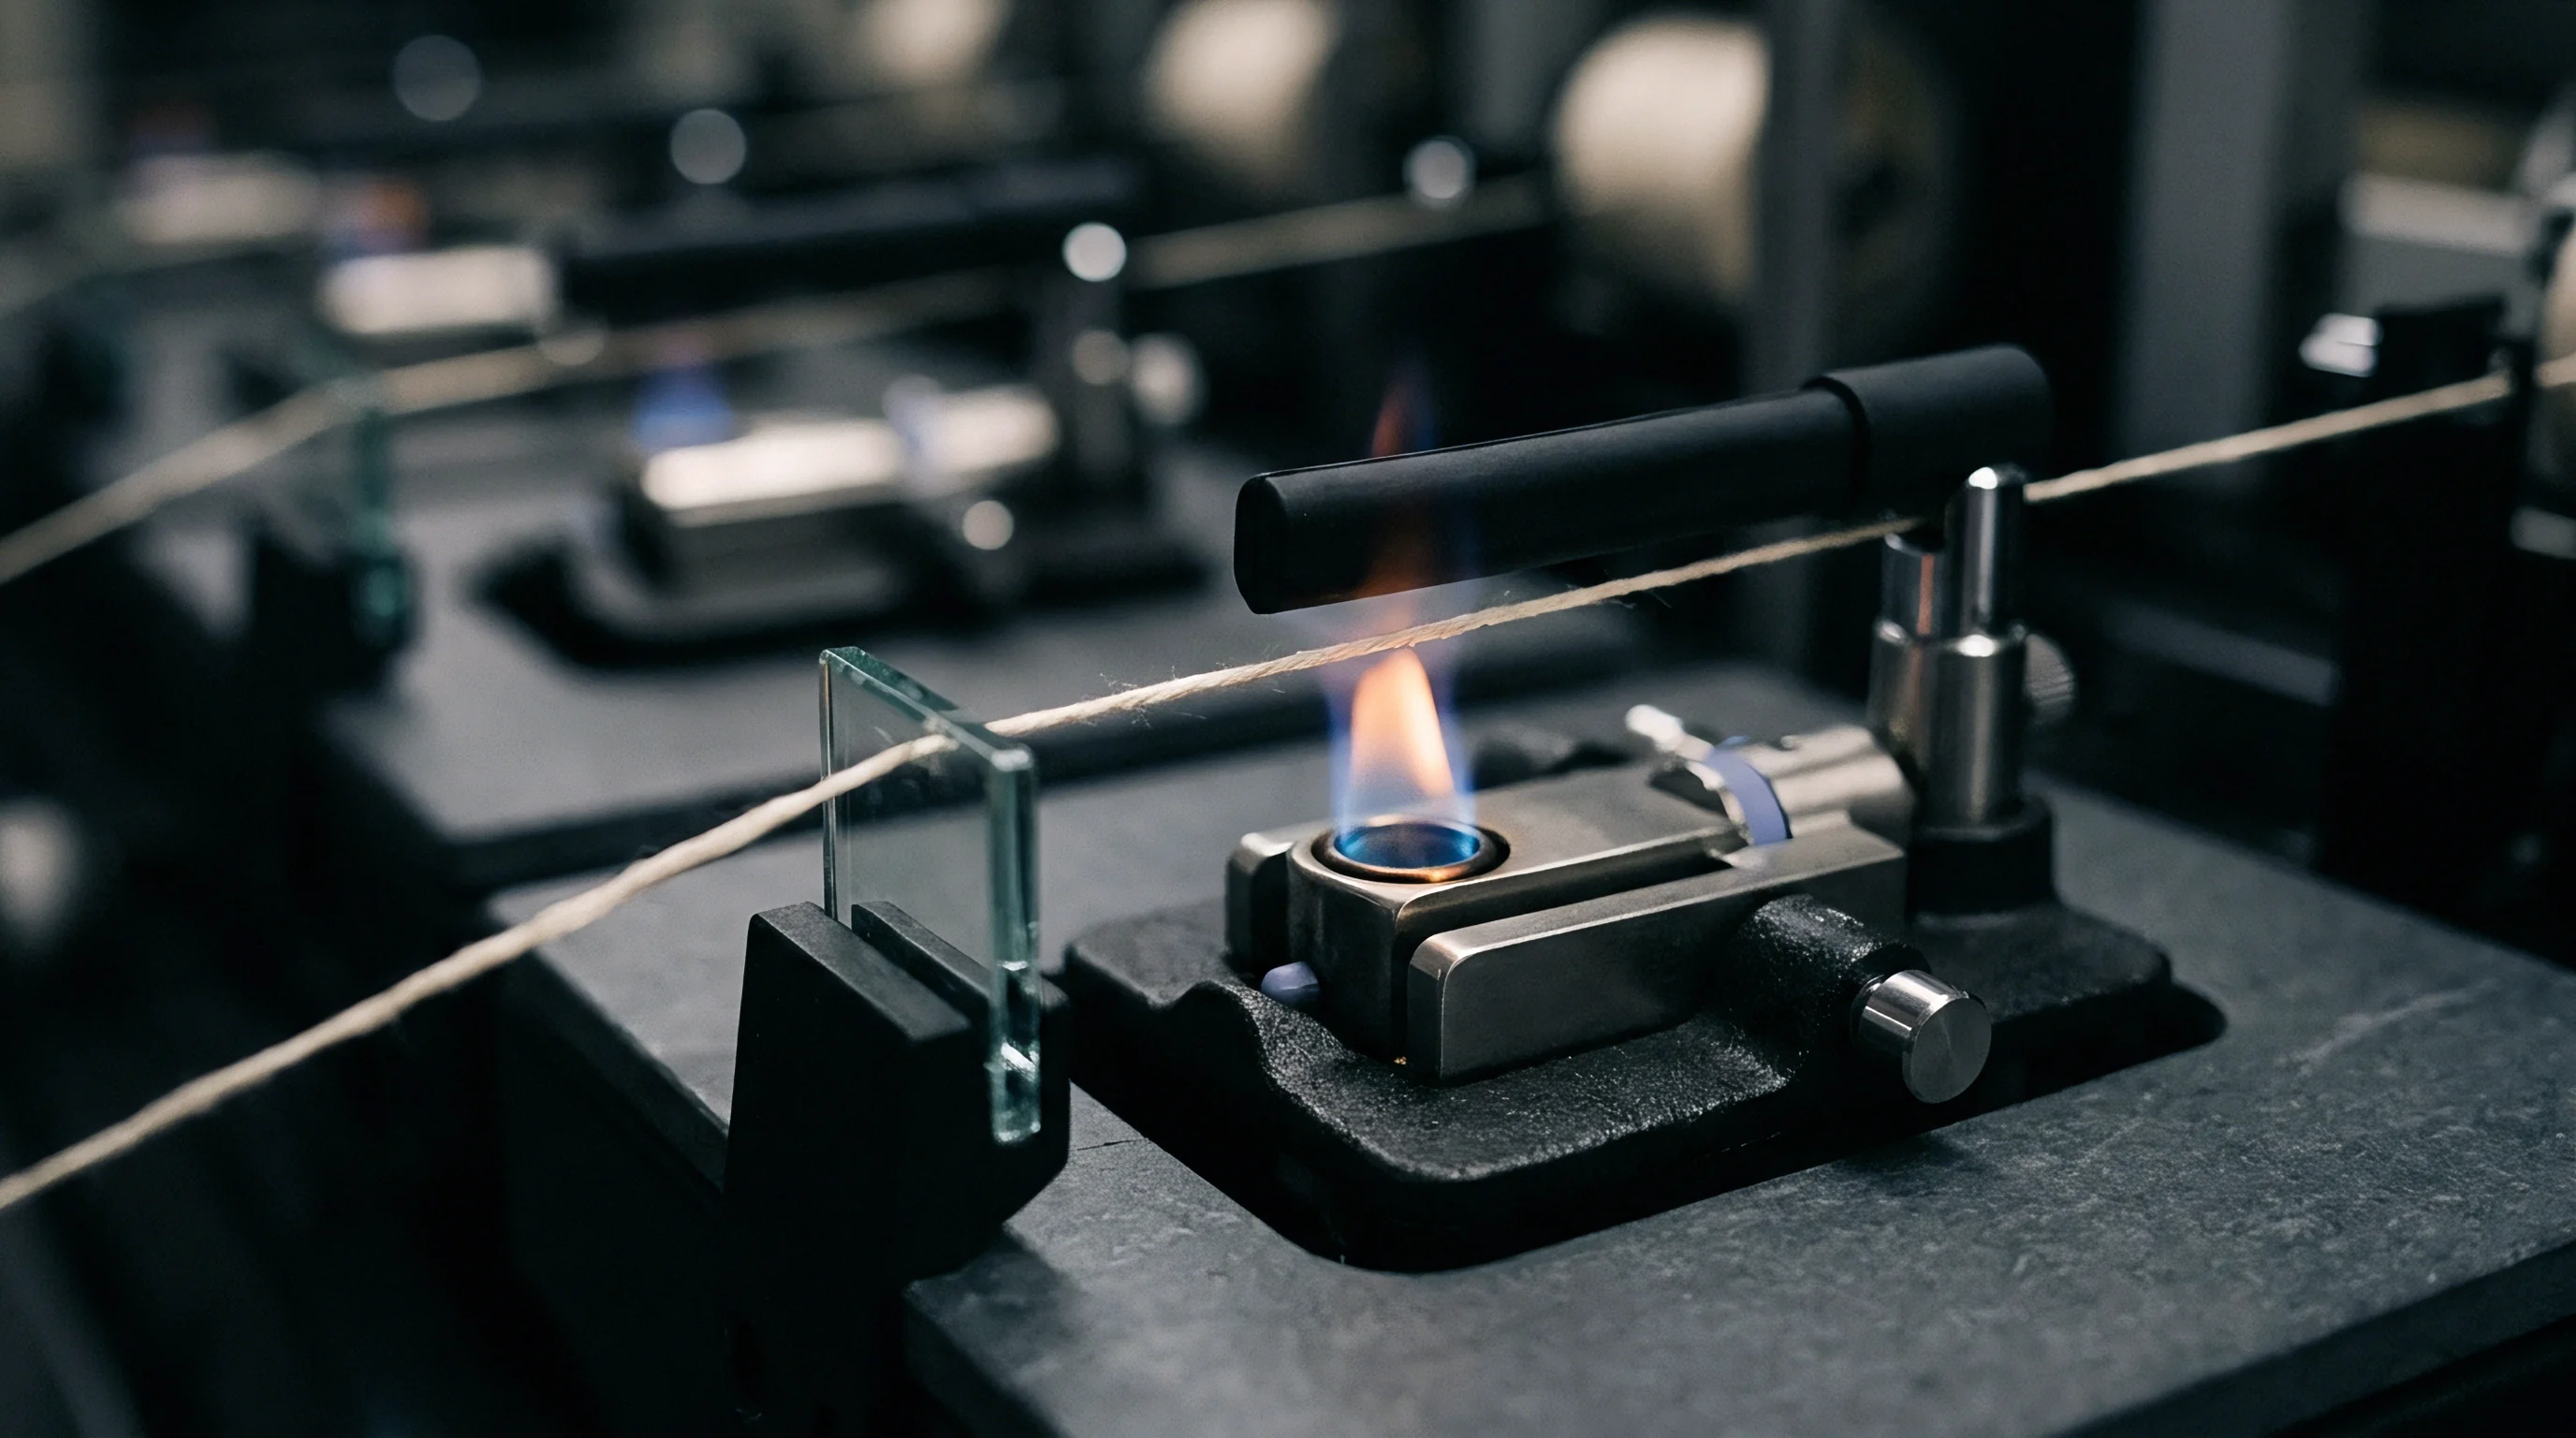
Chain of Custody and Tamper Resistance
Tamper-evident packaging protects sample integrity in transit. Heavy polyethylene bags with tamper-indicating adhesive seals show clear pattern changes if opened before reaching the lab. Technicians inspect and log seal conditions before opening specimens for testing.
Sealed barrier bags prevent moisture loss and preserve sample mass.
Laboratory management software logs core sample arrivals automatically, matching bag barcodes against digital manifests sent by origin inspectors. Mismatched codes or damaged seals trigger immediate quarantine, keeping unverified data out of settlement channels.
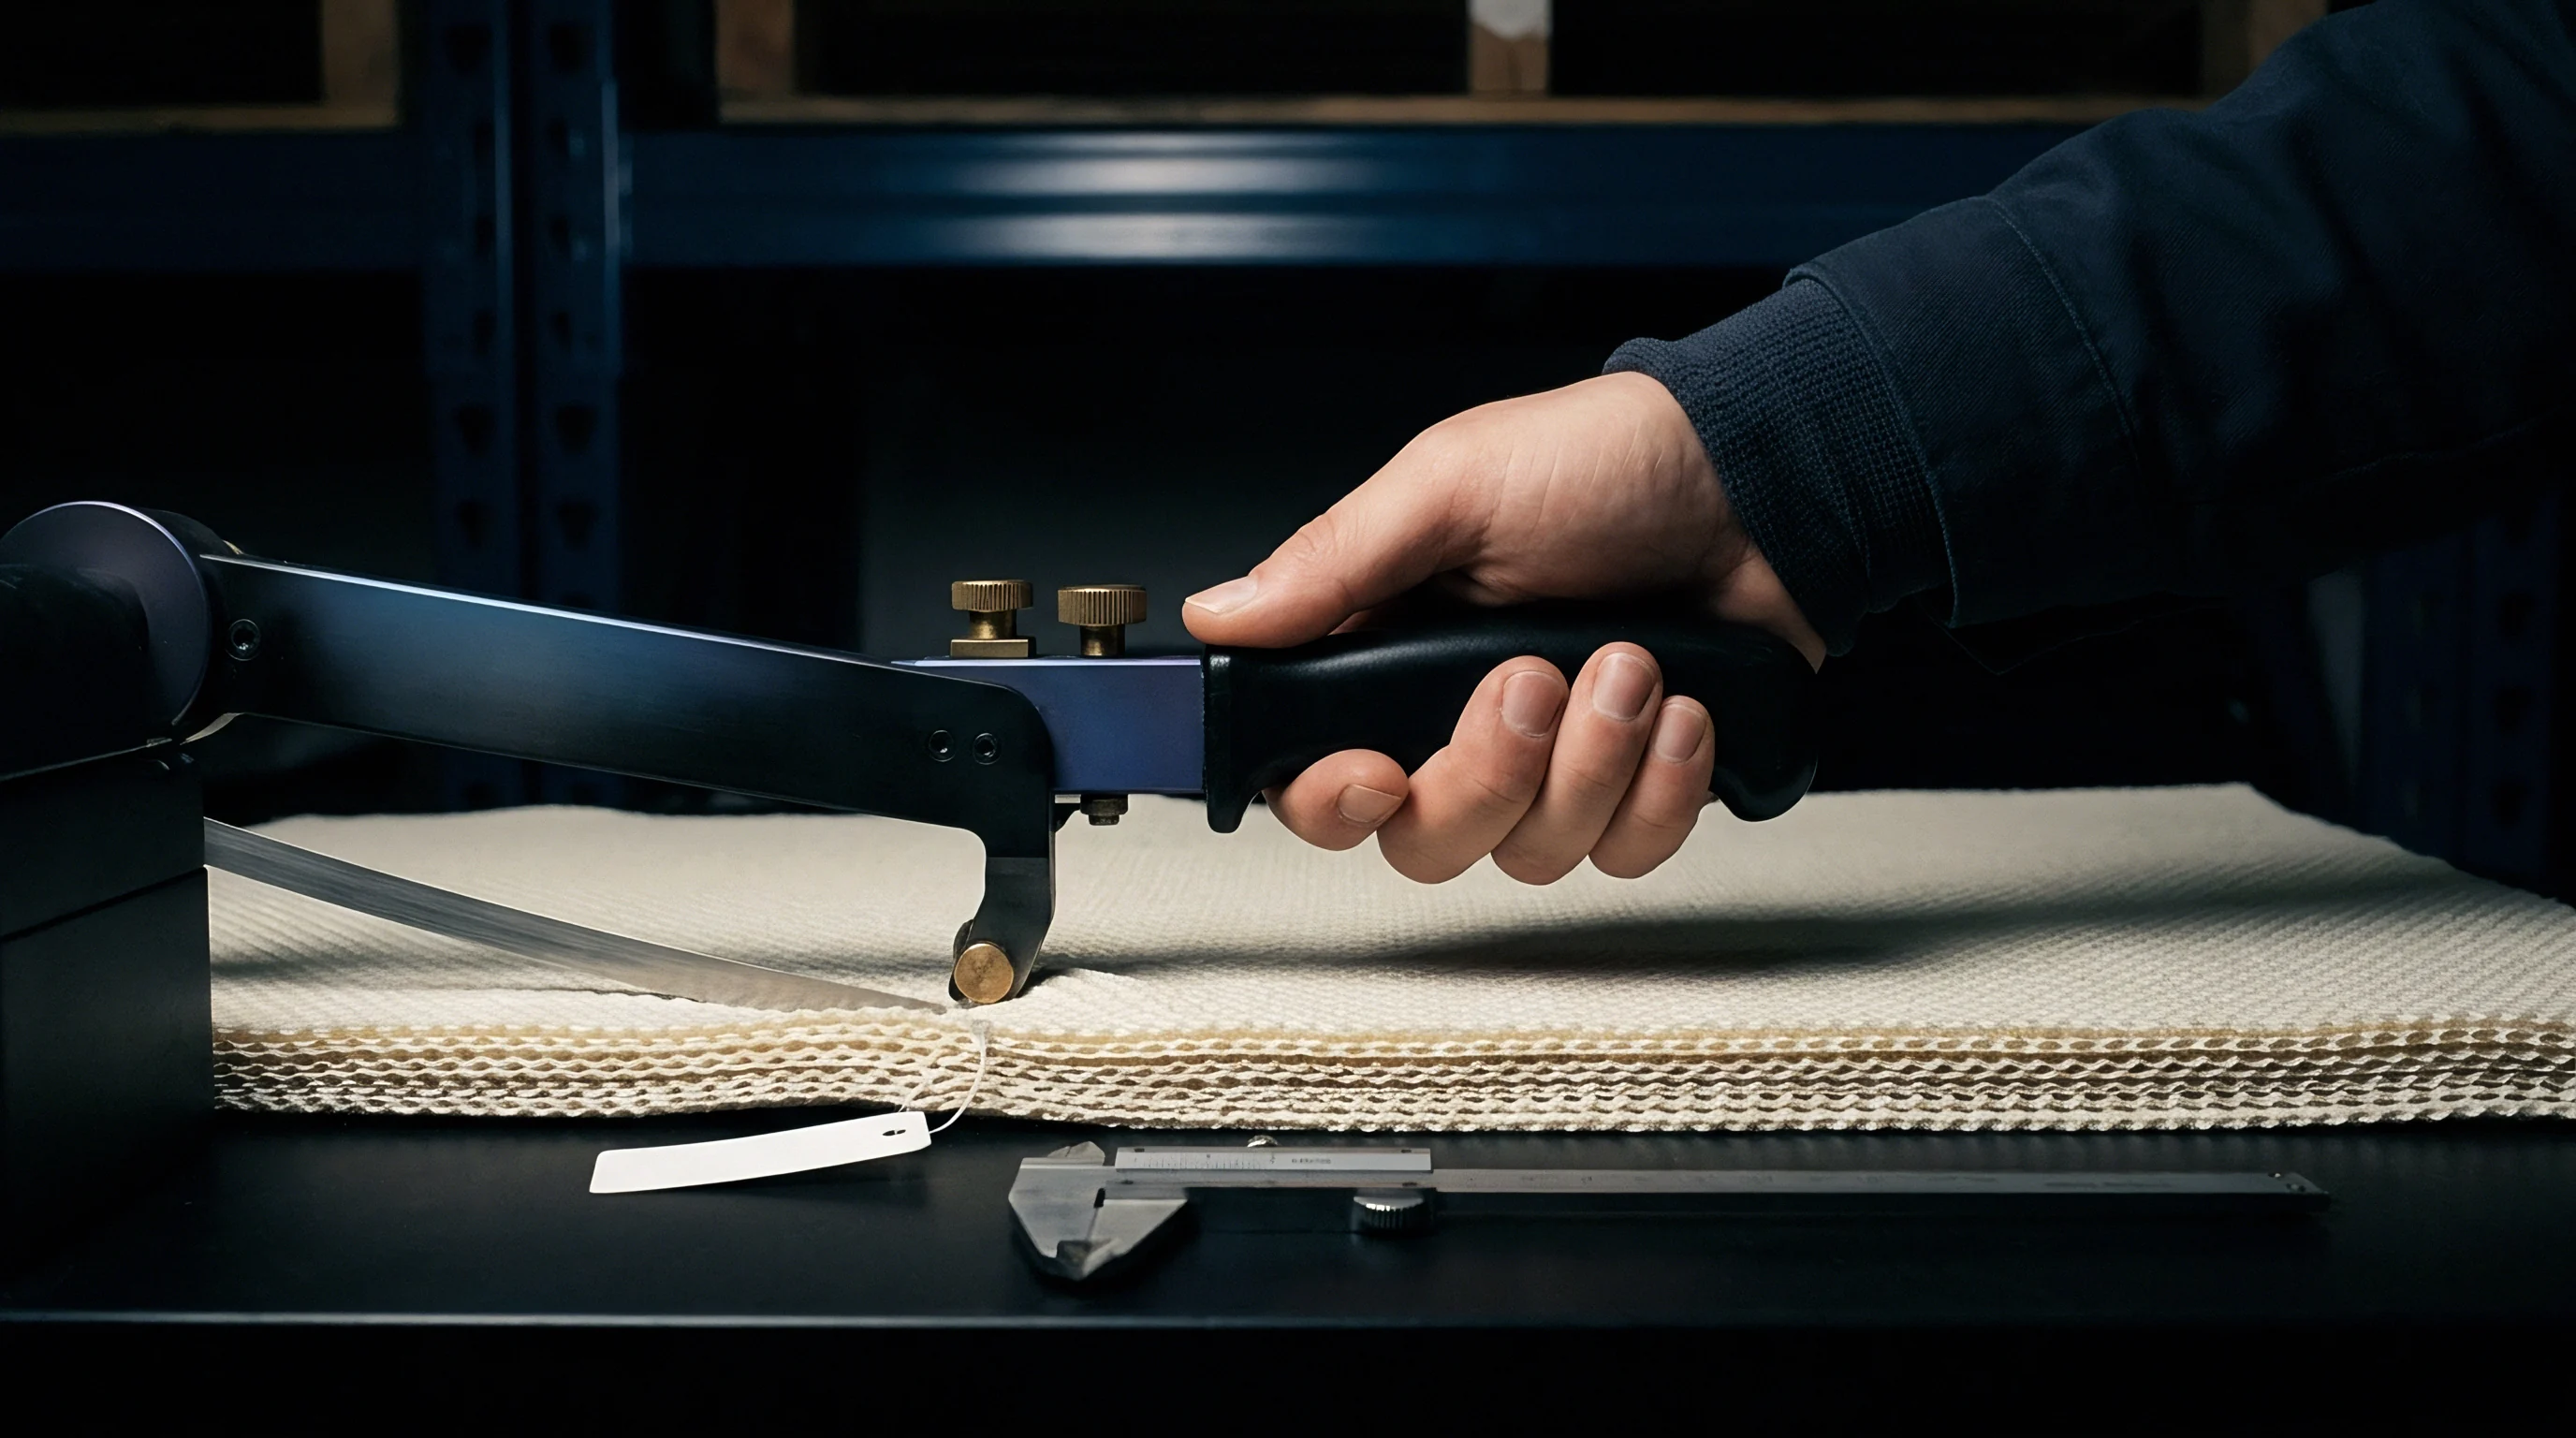
Customs Declaration Alignments and Duty Calculations
Customs authorities rely on core sample dossiers to verify cotton classifications under Harmonized System tariff headings. Raw uncarded and uncombed cotton enters under HS Code 5201.00, where applicable duties depend on declared staple length and net clean mass.
Misdeclaring short-staple cotton under long-staple tariff lines incurs duty evasion penalties. Core sample HVI certificates specifying Upper Half Mean Length confirm declared tariff codes. Customs auditors review laboratory conditioning logs and core test procedures to confirm that declared dry weights represent actual fiber rather than absorbed water.
Discrepancies between container scale weights and core-adjusted commercial mass require formal documentation adjustments. Importers present core moisture and trash certificates to justify tariff adjustments based on net clean cotton mass. Digital dossiers expedite customs clearance, accelerating container release and reducing demurrage costs.
Linking core sample metadata to electronic bills of lading provides transparency across supply chains. Commercial banks release letter-of-credit funds once uploaded core reports confirm that cotton meets contract specifications. Standardized core sampling protects capital, aligns quality parameters, and keeps international trade moving efficiently.